Company Overview
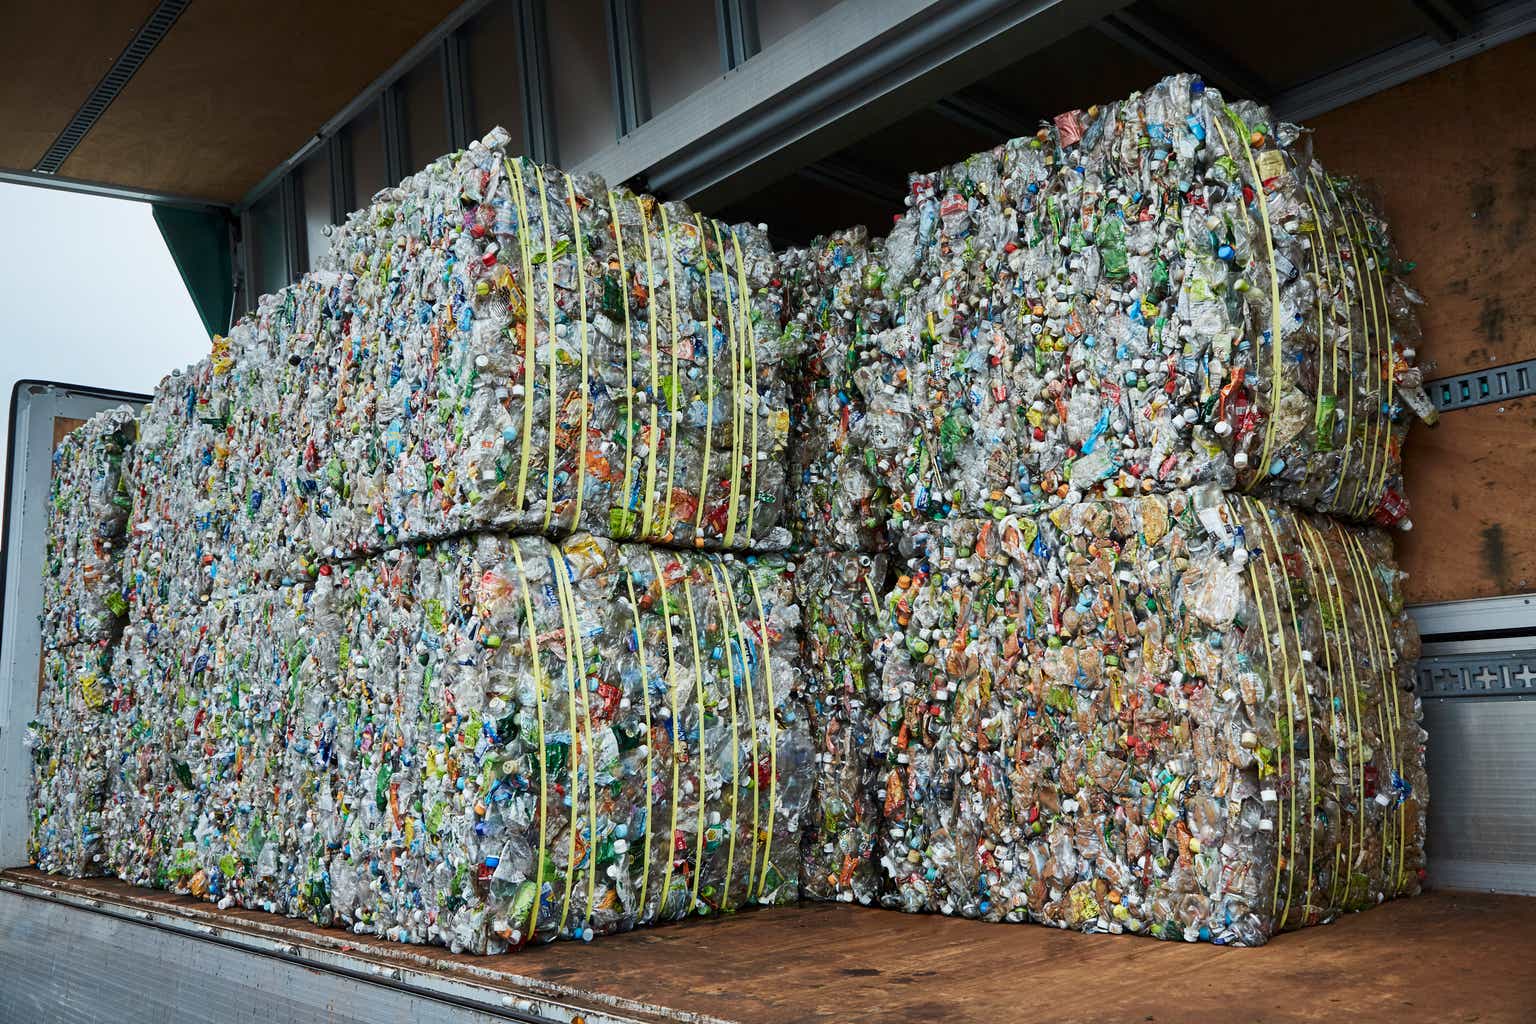
PureCycle Technologies, Inc. engages in the production of recycled polypropylene, utilizing a proprietary license to restore waste PP into ultra-pure recycled PP resin known as PureFive. This material finds various applications in the manufacturing of packaging and labeling for consumer products, textiles, and plastic parts. The company operates within the Industrials sector, specifically focusing on the Pollution & Treatment Controls industry, which categorizes its activities around environmental remediation and material recovery. Regarding scale, the company lists 174 employees and reports a trailing twelve-month revenue of $8.36M, while its market cap is listed as N/A in current data. The absence of a disclosed market cap figure alongside the modest revenue base of $8.36M indicates a position typical of a specialized technology firm where traditional valuation multiples may be unavailable or irrelevant due to current profitability constraints. The employee count of 174 suggests a lean operational structure supporting the production of PureFive resin, though the lack of a definitive market cap prevents a direct comparison with larger peers in the pollution control sector.
Financial Health
The company reported a revenue of $8.36M over the trailing twelve months, yet this generated a net income of $-182,564,992 and an EBITDA of $-137,246,000. The significant gap between the positive revenue figure and the substantial negative net income reveals a cost structure where operating expenses and losses vastly exceed gross revenue, resulting in a net loss that is more than twenty times the size of the annual revenue. Free cash flow stands at $-96,209,504, which indicates that the company is currently consuming cash rather than generating liquidity, thereby limiting its financial flexibility and reliance on external capital sources. Analysis of the three margin metrics shows a Gross Margin of 0.0%, an Operating Margin of -1636.9%, and a Profit Margin of 0.0%, all indicating that the business is not yet covering its direct or indirect costs relative to sales, resulting in negative profitability across all levels. On the balance sheet, the company holds $170.32M in cash against $448.73M in debt, creating a net debt position, while the debt-to-equity ratio is 127.99, signifying a highly leveraged financial structure. The current ratio is 2.26, which indicates that the company possesses more than double the current assets required to meet its short-term liabilities, suggesting adequate short-term liquidity despite the high debt load. Return on Equity is -68.8% and Return on Assets is -12.1%, metrics that reveal management is currently destroying shareholder value and utilizing assets inefficiently in the context of generating positive returns.
Valuation Assessment
The trailing P/E and forward P/E are both listed as N/A, which implies that traditional earnings-based valuation models cannot be applied due to the company's lack of positive net income and the absence of a market cap figure for comparison. The price-to-book ratio is 24.31, a figure that indicates the market is pricing the company at a significant premium over its book value, suggesting high expectations for future asset appreciation or intangible value despite current losses. Alternative valuation metrics such as Price to Sales (N/A) and EV/EBITDA (-12.41) further reflect the company's unprofitable status, with the negative EV/EBITDA ratio confirming that earnings before interest, taxes, depreciation, and amortization are currently negative. The 52-week high is $23.85 and the 52-week low is $6.10, providing a trading range within which the stock price has fluctuated significantly over the past year. Without a specific current price provided in the facts, the valuation relative to this range is defined solely by these bounds, showing a wide dispersion of 244.2% between the high and low. The beta value is 2.07, which means the stock price exhibits more than double the volatility of the broader market, indicating high sensitivity to market movements and increased risk for traders.
Growth & Income
The revenue growth year-over-year and earnings growth year-over-year are both listed as N/A, preventing a direct calculation of whether earnings are growing faster or slower than revenue. Consequently, it is impossible to determine the growth trajectory based on historical data provided, as the company has not yet demonstrated positive earnings growth to compare against revenue figures. For dividend payers, the dividend yield and payout ratio are both N/A, meaning the company does not distribute income to shareholders and instead retains earnings. Since the company reinvests earnings into growth rather than paying dividends, the lack of a payout ratio aligns with its strategy of using available cash, though the negative free cash flow complicates this reinvestment capability. The overall growth and income profile is characterized by a lack of historical growth data and zero dividend income, reflecting a stage of development where the company prioritizes product development and market entry over financial distribution or proven expansion metrics.