कंपनी का अवलोकन
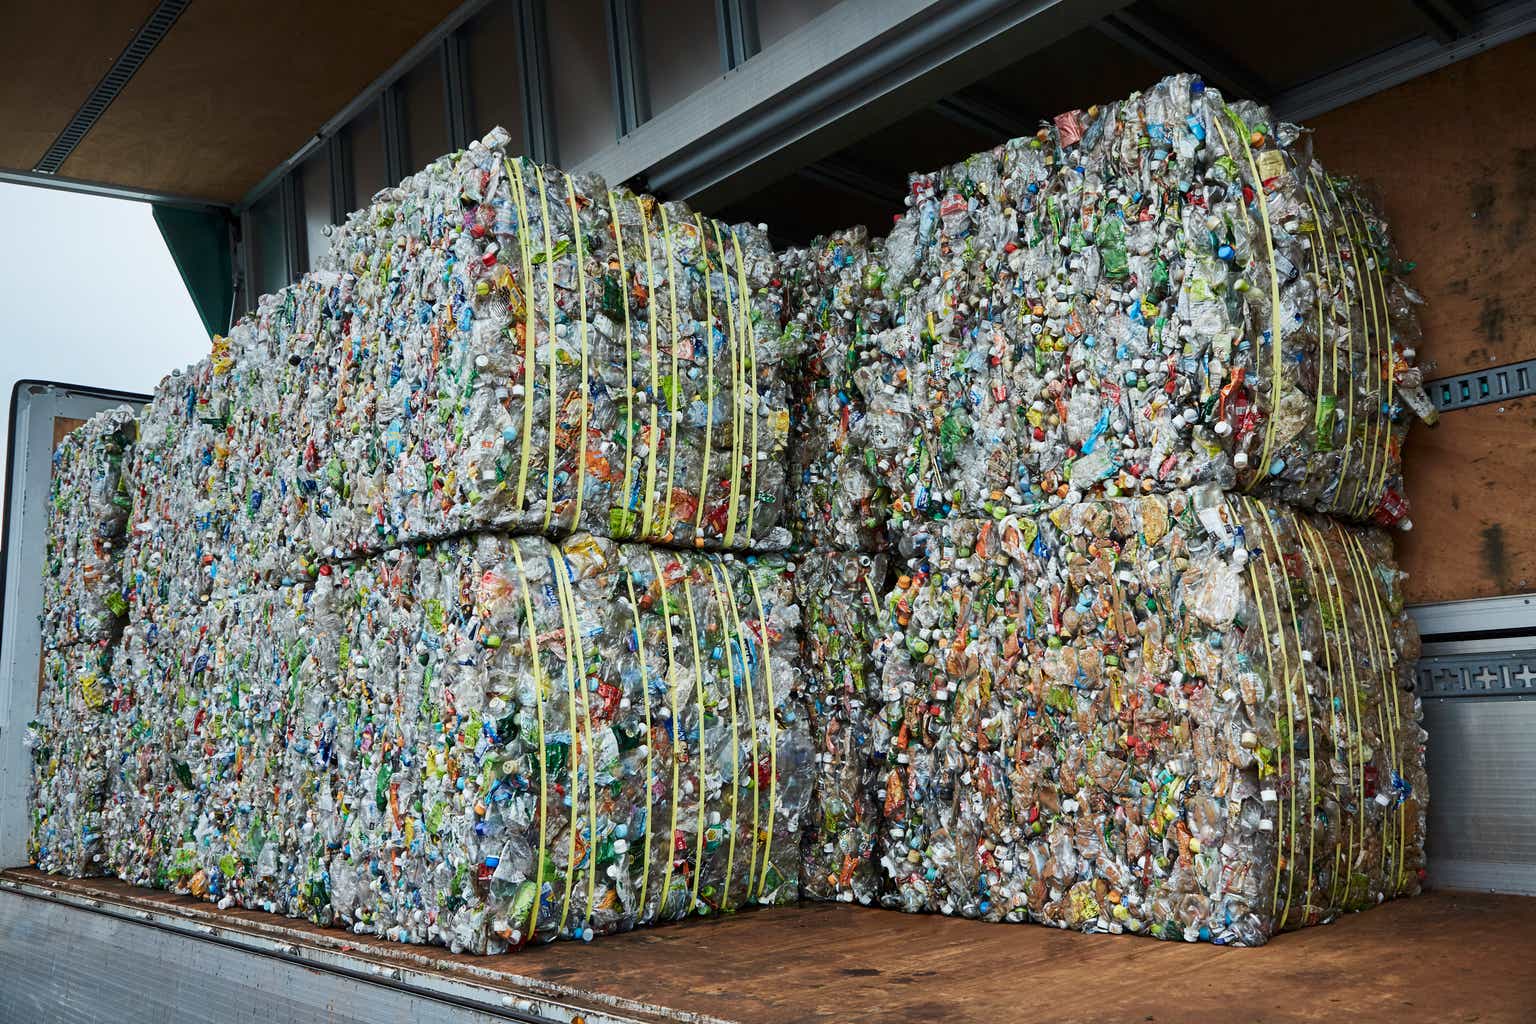
PureCycle Technologies, Inc. is an enterprise focused on the production of recycled polypropylene, utilizing a proprietary license to restore waste polypropylene into ultra-pure recycled PP resin known as PureFive for applications in packaging, textiles, and plastic parts. The company operates within the Industrials sector, specifically under the Pollution & Treatment Controls industry, which positions it as a key player in environmental sustainability and waste management solutions. In terms of scale, the firm employs 174 individuals and maintains a market cap that is currently not available in public data, while reporting a trailing twelve-month revenue of $8.36 million. The absence of a listed market cap figure alongside a revenue stream of $8.36 million suggests that the company operates on a smaller market capitalization scale, which is common for firms in early growth stages or those trading on over-the-counter markets where liquidity and valuation multiples differ from large-cap peers. This operational scope and financial size indicate a specialized niche player rather than a broad-based industrial conglomerate, relying heavily on the commercialization of its PureFive technology to drive future expansion.
वित्तीय स्वास्थ्य
The company reported a trailing twelve-month revenue of $8.36 million, yet it incurred a net loss of $182,564,992, creating a significant gap that reveals an extremely aggressive cost structure or substantial one-time expenses impacting the bottom line. Furthermore, the EBITDA for the period stood at -$137,246,000, indicating that operating earnings before interest, taxes, depreciation, and amortization are deeply negative. The free cash flow was recorded at -$96,209,504, which signifies that the company is burning cash and lacks the immediate financial flexibility to fund operations solely through internal generation without external capital injections. When analyzing profitability metrics, the gross margin is listed at 0.0%, the operating margin is -1636.9%, and the profit margin is 0.0%, collectively indicating that the current business model is not generating profit from sales and is operating at a severe loss relative to revenue generated. The balance sheet shows a cash position of $170.32 million against total debt of $448.73 million, resulting in a debt-to-equity ratio of 127.99, which characterizes the company as highly leveraged with debt significantly exceeding its liquid cash reserves. Despite this leverage, the current ratio stands at 2.26, suggesting that the company holds sufficient current assets to cover its short-term liabilities and maintains a buffer against immediate liquidity crises. Return on equity is -68.8% and return on assets is -12.1%, metrics that reveal management is currently unable to generate returns on the capital invested by shareholders or the assets utilized in the business.
मूल्यांकन आकलन
The trailing P/E ratio and forward P/E ratio are both listed as N/A, implying that traditional earnings-based valuation multiples are not applicable due to the company's consistent losses and lack of positive net income. The price-to-book ratio is 24.31, which indicates a substantial market premium over the company's book value, suggesting that the market values the company's intangible assets, such as its technology and intellectual property, far higher than its tangible net worth. Alternative valuation metrics are also limited; the price-to-sales ratio is N/A and the EV/EBITDA is -12.41, which suggests that standard multiple analysis is difficult without positive earnings and implies a negative enterprise value relative to earnings generation. The stock has exhibited significant volatility, trading with a 52-week high of $23.85 and a 52-week low of $6.10. Based on the available range, the current trading price sits at a point that reflects high uncertainty, fluctuating between the extreme bounds set by market sentiment over the last year. Additionally, the beta value is 2.07, which means the stock's price volatility is more than double that of the broader market, indicating high sensitivity to market movements and increased risk for price swings.
Growth & Income
The revenue growth year-over-year and earnings growth year-over-year are both listed as N/A, indicating that there is no calculated percentage growth available to compare against revenue or earnings trajectories in the current fiscal context. Because the company is not a dividend payer, there is no dividend yield or payout ratio to assess, meaning the firm reinvests any available capital or relies on equity issuance rather than distributing income to shareholders. The overall growth and income profile is characterized by a lack of current profitability and dividend distributions, with the company relying entirely on future market adoption of its recycled polypropylene technology to establish a sustainable growth path. The absence of dividend payments and the presence of negative earnings growth metrics underscore a capital-intensive growth strategy typical of technology-focused industrial firms in the development phase.