NASDAQ · Auto Manufacturers · USD
VinFast Auto Ltd. (VFS) Stock Analysis
VinFast Auto Ltd. (VFS) is a Auto Manufacturers stock listed on NASDAQ and quoted in US Dollar.
Last Updated: October 21, 2026
Price History
No price data available
Hover for the daily close. The dotted line marks the period open.
VFS Key Statistics
As of Oct 21, 2026Trading
- Open
- $2.89
- Previous Close
- $2.87
- Day's Range
- 2.89–3.02
- 52-Week Range
- 2.78–5.29
- Volume
- 533.70K
- BetaHow much the share price moves relative to the wider market. 1.0 moves in line with it; above 1.0 swings more, below 1.0 less.
- 0.92
Valuation
- Market Cap
- $7.00B
- P/E Ratio
- unprofitable
- EPS (ttm)Profit attributable to each share over the last twelve months.
- −1.85
Financials (FY)
- Revenue (FY)
- $90.18T+104.86%
- Net Income (FY)
- −$99.38T
- Profit marginThe share of revenue left as profit after all costs and taxes.
- −113.19%
- Shares Outstanding
- 2.34B
- 1-Year Return
- −11.28%
Dividend and dates
- Earnings Date
- November 24, 2026estimated
- Avg Volume
- 395.44K
Only metrics the company reports are shown. Data provided by Yahoo Finance via yfinance. Updated daily.
Key facts
As of October 21, 2026, VFS closed at $2.99, −11.28% over 1 year.
VinFast Auto Ltd. (VFS) has a market capitalization of $7.00B.
In fiscal 2025, VFS reported revenue of $90.18T.
VFS Stock Return by Calendar Year
VinFast Auto Ltd. (VFS) return since Sep 2021: what $10,000 became
- 1 year
- $10,000 $8,872
- −11.28%
- 5 years
- $10,000 $3,060
- −69.40%
- Since Sep 2021
- $10,000 $3,052
- −69.48%
If you had invested $10,000 in VinFast Auto Ltd. (VFS) at the close on September 7, 2021, the earliest close on record here, it would have been worth $3,052 at the close on October 21, 2026: −69.48% in total, −20.69% a year, over a partial period shorter than 10 years. A historical calculation from closing prices adjusted for splits and dividends, before fees and taxes.
Calendar-year returns computed from daily closing prices. Partial years are shown muted and marked with an asterisk.
| Year | Return |
|---|---|
| 2026 (partial year) | −10.48% |
| 2025 | −17.12% |
| 2024 | −51.85% |
| 2023 | −16.30% |
| 2022 | +3.20% |
| 2021 (partial year) | −1.09% |
As of October 21, 2026.
VFS Revenue and Earnings by Fiscal Year
FY ends December| Fiscal year | Revenue | Net income | Net margin |
|---|---|---|---|
| 2025 | $90.18T | −$99.38T | −110.2% |
| 2024 | $44.02T | −$77.27T | −175.5% |
| 2023 | $27.88T | −$60.17T | −215.8% |
| 2022 | $13.93T | −$52.89T | −379.7% |
| Fiscal year | Revenue | Gross profit | Operating income | Net income | Net margin |
|---|---|---|---|---|---|
| 2025 | $90.18T | −$40.91T | −$73.47T | −$99.38T | −110.2% |
| 2024 | $44.02T | −$25.28T | −$54.06T | −$77.27T | −175.5% |
| 2023 | $27.88T | −$13.71T | −$41.57T | −$60.17T | −215.8% |
| 2022 | $13.93T | −$13.05T | −$43.80T | −$52.89T | −379.7% |
Annual figures as reported, in the company's reporting currency. As of December 31, 2025.
VFS Valuation vs Auto Manufacturers Median
Median of 26 stocks| Metric | VFS | Auto Manufacturers median | vs median |
|---|---|---|---|
| Profit margin | −113.19% | −4.35% | 108.8 pts below |
Medians across 26 Auto Manufacturers stocks that report the metric. Medians, not averages, so one outlier cannot move them. As of October 21, 2026.
Recent News
Chardan Capital Maintains Buy on VinFast Auto, Lowers Price Target to $5
BenzingaCantor Fitzgerald Maintains Overweight on VinFast Auto, Lowers Price Target to $4
BenzingaVinFast Auto (VFS) Stock Price Sinks As Q2 Earnings Deepen Losses
YahooVinFast Auto Ltd. (VFS) Q2 2026 Earnings Call Transcript
SeekingAlphaWhat VinFast Auto (VFS) Said on Its Q2 Earnings Call
MarketBeatVinFast misses EPS estimates despite revenue beat
Yahoo





All 20 articles ↓Show fewer ↑
VinFast Says Real Estate Could Cover Its EV Cash Burn
BenzingaVinFast Reports Unaudited Second Quarter 2026 Financial Results
YahooVinFast Auto: Impressive Sales, Terrible Economics
SeekingAlphaUnder $13 a Day: VinFast Unveils October Lease & Financing Offers for 2027 VF 8 and VF 9 Electric SUVs
YahooVinFast Auto Q2 EPS $(0.53) Misses $(0.33) Estimate, Sales $1.204B Beat $1.149B Estimate
BenzingaShould Delivery Surge Require Action From VinFast (VFS) Investors?
YahooVINFAST'S OPENING IN EUROPE - PEOPLE WHO SWITCH TO ELECTRIC RARELY LOOK BACK
YahooVinFast Auto (VFS) Targets Europe Expansion, Is The Valuation Gap Too Wide?
YahooVinFast (VFS) Stock Looks Overvalued As Scooter Demand Surges
YahooHow Investors May Respond To VinFast Auto (VFS) Expanding Its Electric Bus Footprint In Europe And The U.S.
YahooWhy Is VinFast Auto (VFS) Entering The U.S. Electric Bus Market?
YahooVINFAST INTRODUCES ELECTRIC BUS LINEUP IN THE U.S, DOUBLING DOWN ON SUSTAINABLE MOBILITY GROWTH
YahooVinFast (VFS) Taps Founder’s Son to Lead its Global Growth Push
YahooVinFast Helps Bring New-Car Confidence to Canada’s Used EV Market
Yahoo


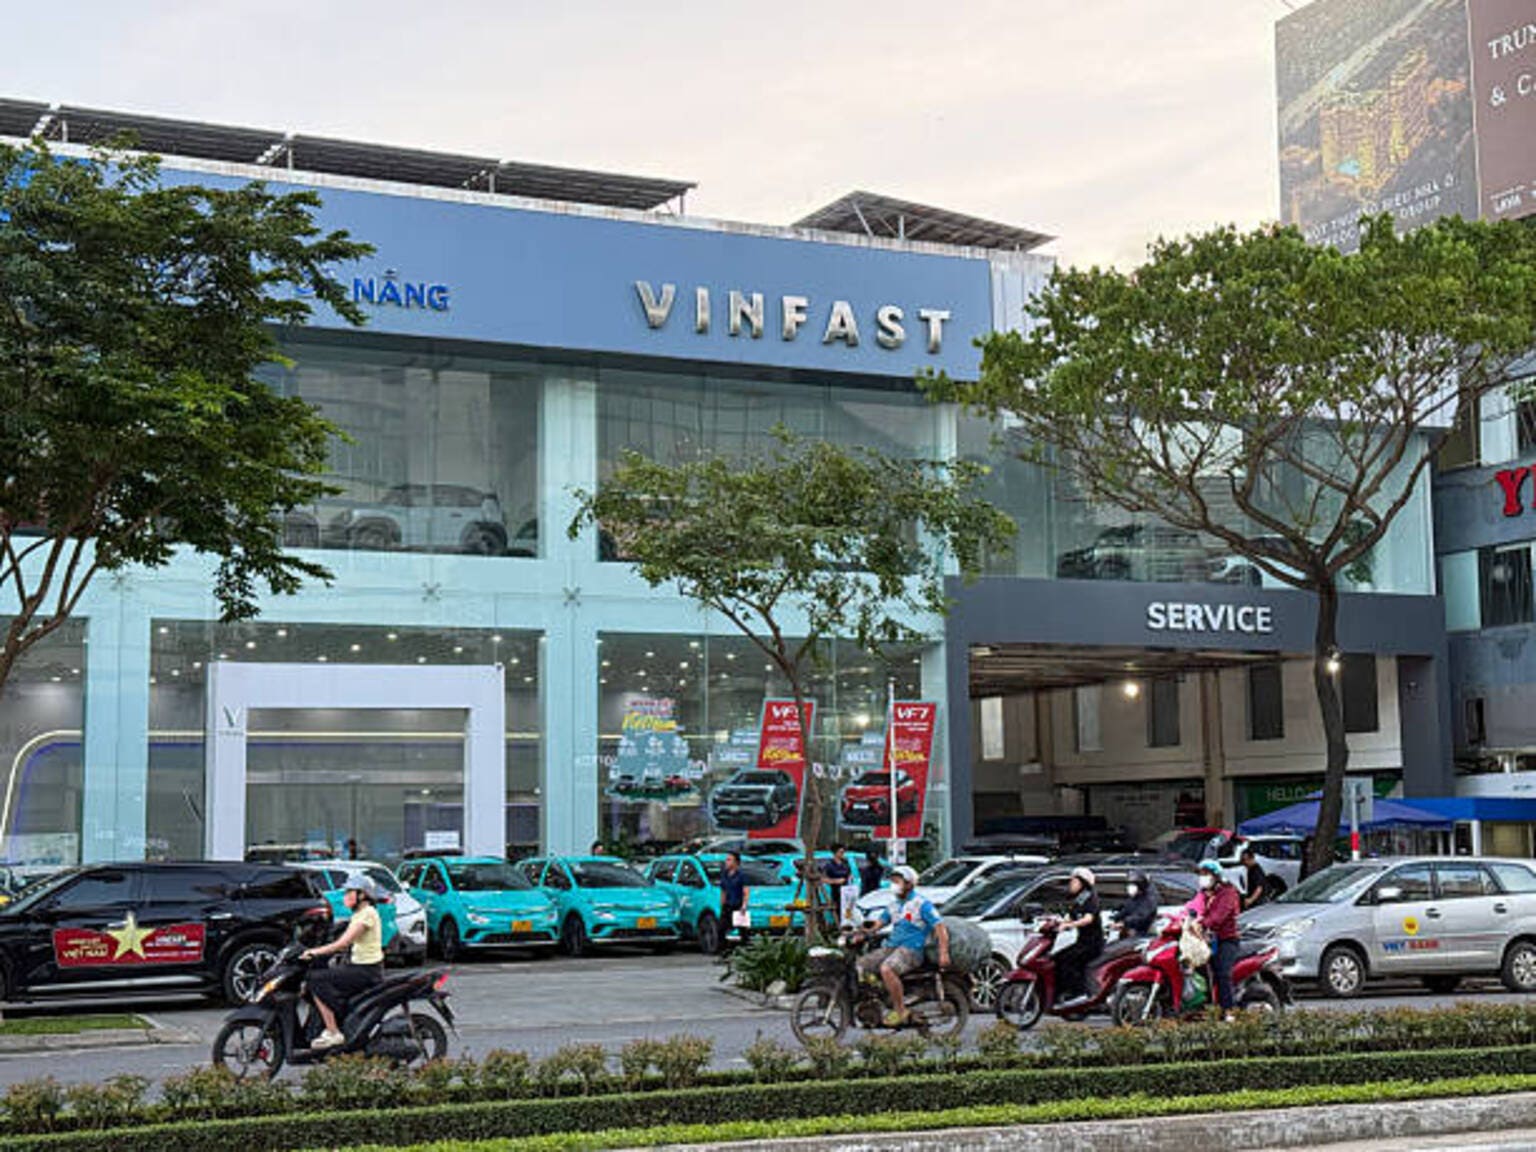







News provided by third-party sources. Not financial advice.
Analysis
Data-derivedEvery figure above is read from this page's own data on each daily rebuild. Informational only, not financial advice. As of October 21, 2026.
Related Auto Manufacturers Stocks
Tesla, Inc.
$1.53T
TMToyota Motor Corporation
$229.51B
RACEFerrari N.V.
$69.68B
GMGeneral Motors Company
$66.78B
FFord Motor Company
$47.45B
HMCHonda Motor Co., Ltd.
$44.08B
Popular Consumer Cyclical Stocks
Amazon.com, Inc.
$2.83T
HDThe Home Depot, Inc.
$313.41B
BABAAlibaba Group Holding Limited
$270.19B
MCDMcDonald's Corporation
$174.26B
TJXThe TJX Companies, Inc.
$160.07B