NYSE · Beverages - Brewers · USD
Fomento Económico Mexicano, S.A.B. de C.V. (FMX) Stock Analysis
Fomento Económico Mexicano, S.A.B. de C.V. (FMX) is a Beverages - Brewers stock listed on NYSE and quoted in US Dollar.
Last Updated: October 21, 2026
Price History
No price data available
Hover for the daily close. The dotted line marks the period open.
FMX Key Statistics
As of Oct 21, 2026Trading
- Open
- $128.92
- Previous Close
- $129.11
- Day's Range
- 127.66–129.79
- 52-Week Range
- 90.87–141.47
- Volume
- 729.58K
- BetaHow much the share price moves relative to the wider market. 1.0 moves in line with it; above 1.0 swings more, below 1.0 less.
- 0.18
Valuation
- Market Cap
- $43.60B
- P/E Ratio
- 9.09
- Forward P/EShare price divided by forecast earnings for the year ahead, rather than the year just past.
- 24.80
- PEG RatioThe P/E ratio divided by the expected earnings growth rate. It puts a high P/E in the context of how fast profits are growing.
- 4.73
- P/S ratioMarket value divided by annual revenue. Useful for companies that are not yet profitable, where a P/E cannot be calculated.
- 0.05
- EPS (ttm)Profit attributable to each share over the last twelve months.
- 14.08
Financials (FY)
- Revenue (FY)
- $840.95B+7.60%
- Net Income (FY)
- $19.43B−27.32%
- Profit marginThe share of revenue left as profit after all costs and taxes.
- 3.59%
- Shares Outstanding
- 340.68M
- 1-Year Return
- +41.58%
Dividend and dates
- Dividend
- $4.57+3.54%
- Ex-Dividend Date
- October 14, 2026
- Earnings Date
- October 28, 2026
- Avg Volume
- 488.51K
Only metrics the company reports are shown. Data provided by Yahoo Finance via yfinance. Updated daily.
Key facts
As of October 21, 2026, FMX closed at $127.98, +41.58% over 1 year.
Fomento Económico Mexicano, S.A.B. de C.V. (FMX) has a market capitalization of $43.60B.
In fiscal 2025, FMX reported revenue of $840.95B.
FMX Stock Return by Calendar Year
Fomento Económico Mexicano, S.A.B. de C.V. (FMX) 10-year return: what $10,000 became
- 1 year
- $10,000 $14,158
- +41.58%
- 5 years
- $10,000 $18,178
- +81.78%
- 10 years
- $10,000 $16,587
- +65.87%
If you had invested $10,000 in Fomento Económico Mexicano, S.A.B. de C.V. (FMX) 10 years ago, at the close on October 21, 2016, it would have been worth $16,587 at the close on October 21, 2026: +65.87% in total, +5.19% a year, with dividends reinvested. A historical calculation from closing prices adjusted for splits and dividends, before fees and taxes.
Calendar-year returns computed from daily closing prices. Partial years are shown muted and marked with an asterisk.
| Year | Return |
|---|---|
| 2026 (partial year) | +30.41% |
| 2025 | +24.07% |
| 2024 | −32.60% |
| 2023 | +70.14% |
| 2022 | +2.90% |
| 2021 | +4.05% |
| 2020 | −17.78% |
| 2019 | +11.64% |
| 2018 | −6.85% |
| 2017 | +25.14% |
| 2016 (partial year) | −16.08% |
As of October 21, 2026.
FMX Revenue and Earnings by Fiscal Year
FY ends December| Fiscal year | Revenue | Net income | Net margin |
|---|---|---|---|
| 2025 | $840.95B | $19.43B | 2.3% |
| 2024 | $781.59B | $26.74B | 3.4% |
| 2023 | $702.69B | $65.69B | 9.3% |
| 2022 | $597.01B | $23.91B | 4.0% |
| Fiscal year | Revenue | Gross profit | Operating income | Net income | Net margin |
|---|---|---|---|---|---|
| 2025 | $840.95B | $341.58B | $72.16B | $19.43B | 2.3% |
| 2024 | $781.59B | $321.51B | $70.41B | $26.74B | 3.4% |
| 2023 | $702.69B | $279.51B | $57.36B | $65.69B | 9.3% |
| 2022 | $597.01B | $241.52B | $63.63B | $23.91B | 4.0% |
Annual figures as reported, in the company's reporting currency. As of December 31, 2025.
FMX Dividend History
Dividends per share, 2025 · 3 payments
| Year | Dividends per share | Payments | Change |
|---|---|---|---|
| 2026* | $3.62 | 2 | — |
| 2025 | $4.69 | 3 | +52.6% |
| 2024 | $3.07 | 3 | +47.4% |
| 2023 | $2.08 | 2 | +22.9% |
| Year | Dividends per share | Payments | Change |
|---|---|---|---|
| 2026 (partial year) | $3.62 | 2 | — |
| 2025 | $4.69 | 3 | +52.6% |
| 2024 | $3.07 | 3 | +47.4% |
| 2023 | $2.08 | 2 | +22.9% |
| 2022 | $1.70 | 2 | +48.0% |
| 2021 | $1.15 | 2 | −19.5% |
| 2020 | $1.42 | 2 | −6.8% |
| 2019 | $1.53 | 2 | +2.4% |
| 2018 | $1.49 | 2 | +9.4% |
| 2017 | $1.36 | 2 | +99.3% |
| 2016 | $0.68 | 1 | — |
Most recent payment: $1.81 per share, ex-dividend July 15, 2026. Per-share amounts summed by calendar year from ex-dividend dates. Partial years are shown muted and marked with an asterisk.
FMX Valuation vs Beverages - Brewers Median
Median of 8 stocks| Metric | FMX | Beverages - Brewers median | vs median |
|---|---|---|---|
| P/E | 9.09 | 16.94 | 46% below |
| P/S ratio | 0.05 | 0.66 | 0.1x the median |
| Profit margin | 3.59% | 3.56% | 0.0 pts above |
Medians across 8 Beverages - Brewers stocks that report the metric. Medians, not averages, so one outlier cannot move them. As of October 21, 2026.
Recent News
Fomento Economico Mexicano ADR (NYSE:FMX): A Quality Stock Candidate for Long-Term Investors
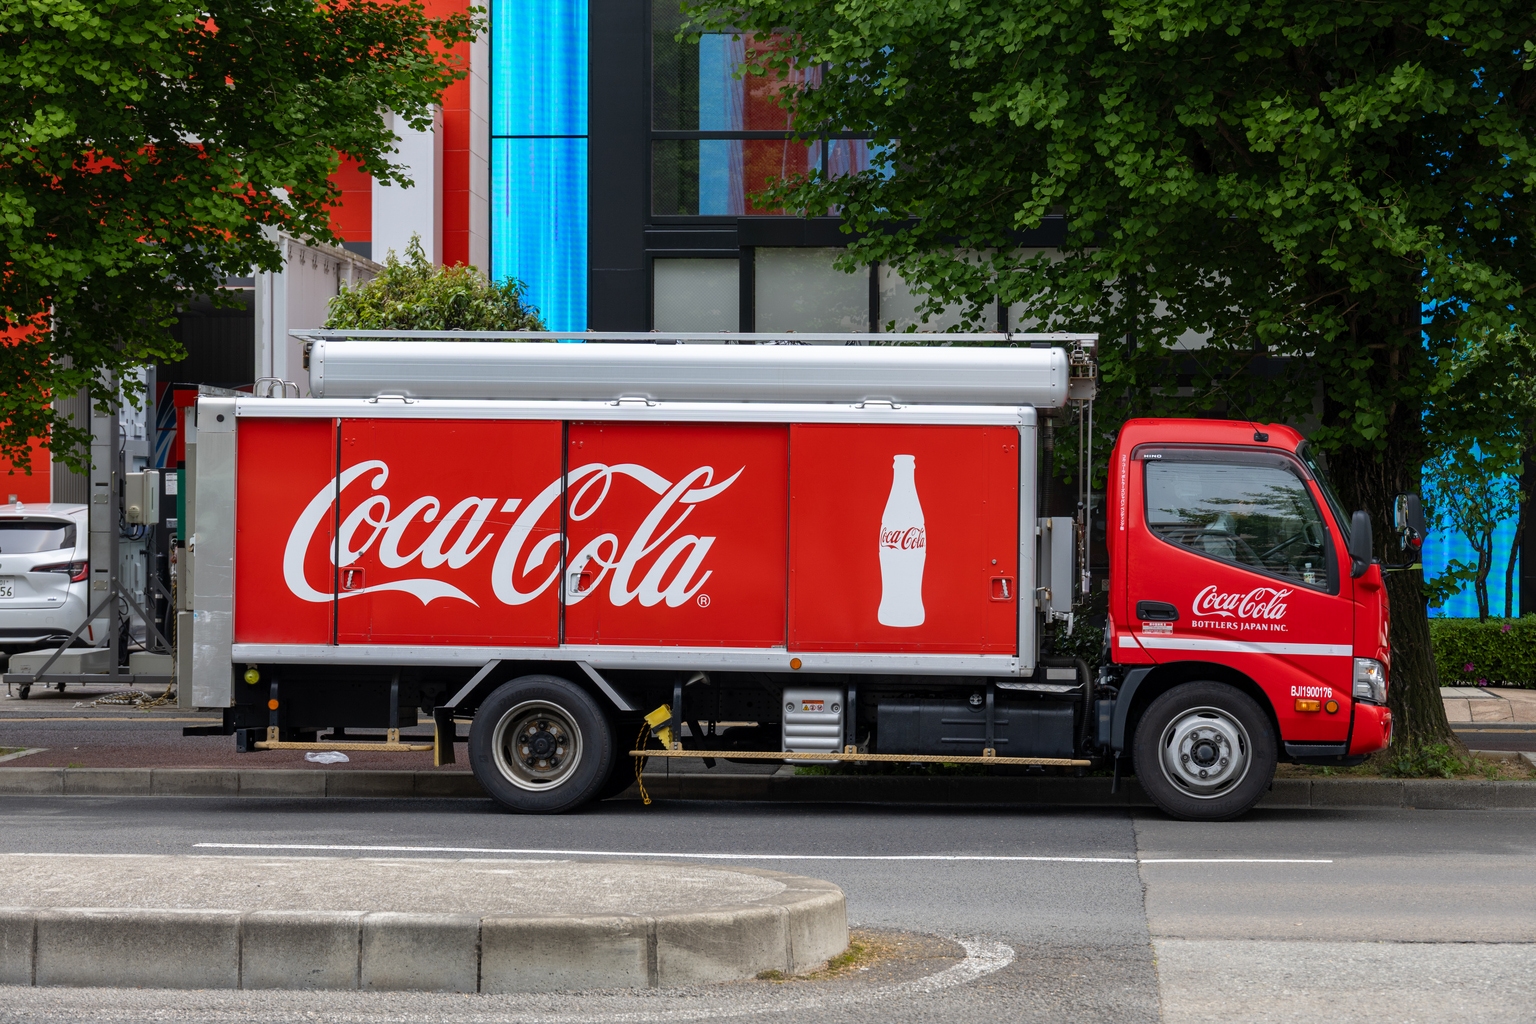
ChartMillFomento Económico: Quench Your Thirst For Value With The Largest Bottler Of Coca-Cola
SeekingAlphaUBS Maintains Neutral on Fomento Economico, Lowers Price Target to $130
BenzingaFomento Economico Q2 2026 Earnings Call Transcript
BenzingaB of A Securities Upgrades Fomento Economico to Buy, Raises Price Target to $150
BenzingaFMX Q2 Earnings Call Highlights OXXO Strategy Shift
Yahoo





All 9 articles ↓Show fewer ↑



News provided by third-party sources. Not financial advice.
Analysis
Data-derivedEvery figure above is read from this page's own data on each daily rebuild. Informational only, not financial advice. As of October 21, 2026.
Related Beverages - Brewers Stocks
Anheuser-Busch InBev SA/NV
$154.81B
ABEVAmbev S.A.
$50.41B
STZConstellation Brands, Inc.
$22.34B
TAPMolson Coors Beverage Company
$7.36B
SAMThe Boston Beer Company, Inc.
$1.87B
BR.TOBig Rock Brewery Inc.
CA$15.99M
Popular Consumer Defensive Stocks
Walmart Inc.
$937.46B
COSTCostco Wholesale Corporation
$442.38B
KOThe Coca-Cola Company
$398.76B
PGThe Procter & Gamble Company
$364.29B
PMPhilip Morris International Inc.
$307.76B