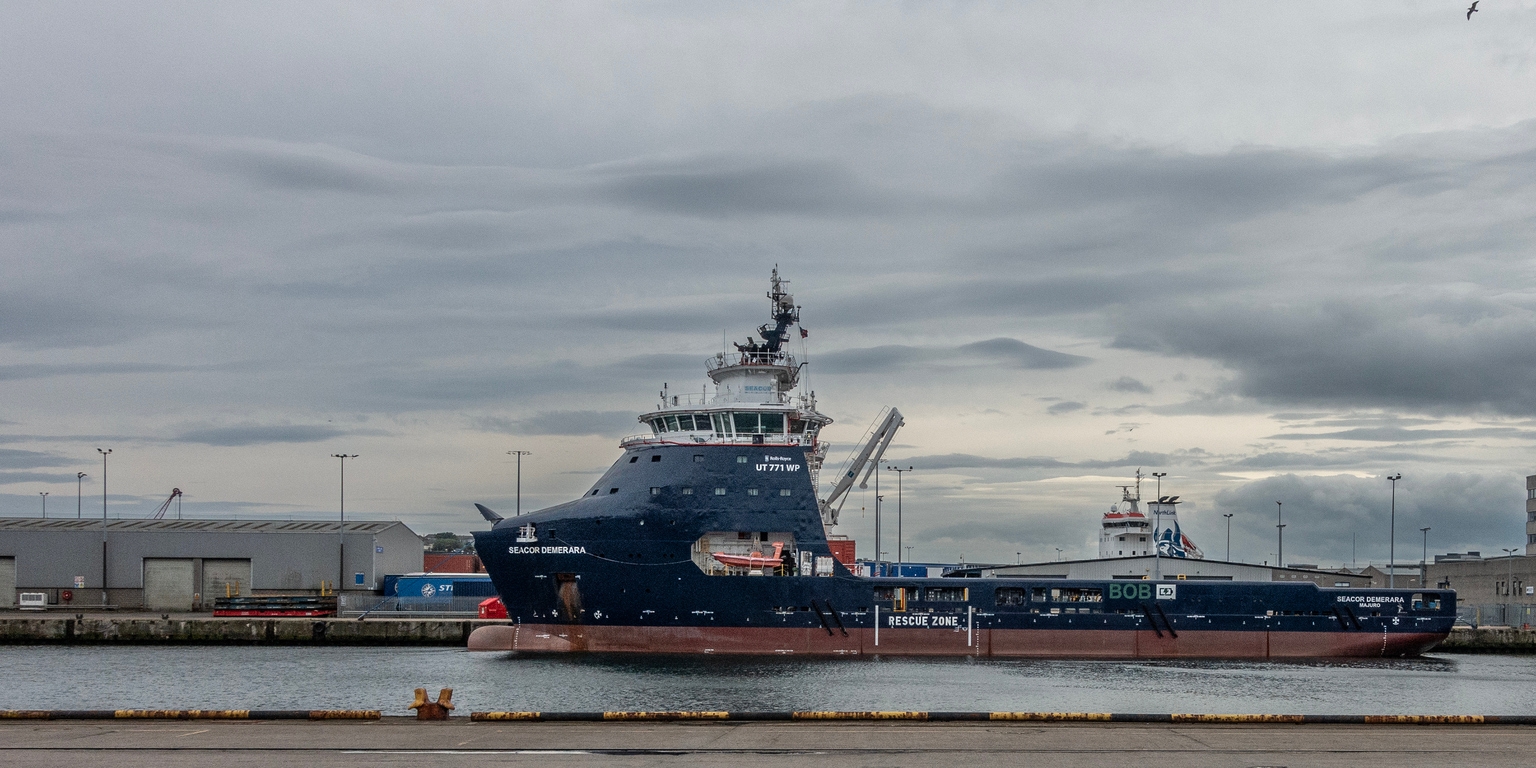
SEACOR Marine Holdings Inc. (SMHI) 股票分析
工业SEACOR Marine Holdings Inc.
$7.18
$-0.03 (-0.42%)
最后更新: 2026年5月26日
价格走势
暂无价格数据
分析
公司概述
SEACOR Marine Holdings Inc. operates within the Industrials sector, specifically focusing on the Marine Shipping industry, where it provides essential marine and support transportation services to offshore energy facilities globally. The company's core business involves the operation and management of a specialized fleet of offshore support vessels designed to deliver cargo and personnel to various offshore installations, including emerging offshore wind farms. In terms of scale, the company currently holds a market capitalization of $211.30M and employs a workforce of 889 individuals to support its operational activities. Its reported trailing twelve-month revenue stands at $227.83M, which places the company in a small-cap category relative to major global shipping peers, indicating a niche position in the offshore logistics market rather than a dominant market leader. These valuation metrics suggest that the company operates with a relatively modest asset base and revenue stream, making it sensitive to fluctuations in the specific sectors of offshore energy it serves.
财务健康
The company generated revenue of $227.83M over the trailing twelve months, yet recorded a net income of $-27,844,000 and an EBITDA of $-2,626,000. The significant disparity between the positive revenue figure and the substantial negative net income reveals a cost structure where operating expenses and overheads are consuming nearly the entire revenue base, preventing the generation of a profit. Furthermore, the negative EBITDA indicates that the company's core operations are currently unable to cover interest, taxes, depreciation, and amortization, pointing to severe operational inefficiencies or high fixed cost burdens in the current cycle. This financial environment results in a free cash flow of $-60,791,248, which signifies that the company is burning cash and lacks the financial flexibility to fund internal expansion or weather prolonged downturns without external capital injections. Margin analysis highlights these structural challenges, with a gross margin of 19.7% suggesting some pricing power on services, but this is completely negated by an operating margin of -25.6% and a profit margin of -12.2%, indicating that overhead costs are excessively high relative to sales. The balance sheet presents a highly leveraged position with total debt of $335.68M against cash reserves of only $68.93M, resulting in a debt-to-equity ratio of 126.83, which reflects a capital structure heavily reliant on creditor financing rather than equity. Liquidity analysis shows a current ratio of 2.54, suggesting that the company technically possesses sufficient current assets to cover its short-term liabilities, though this buffer is strained by the rapid cash burn rate. Return metrics further illustrate management ineffectiveness, with a return on equity of -9.9% and a return on assets of -4.5%, demonstrating that the management team has failed to generate value from the capital invested in the business.
估值评估
Valuation metrics for SEACOR Marine Holdings Inc. present a complex picture due to the company's negative earnings, with a trailing P/E ratio of N/A and a forward P/E of -3.66. The distinction between a non-existent trailing P/E and a negative forward P/E implies that the market is attempting to price in a turnaround, though the negative multiple suggests that future earnings are expected to be negative or that the company is currently unprofitable on a forward basis. A price-to-book ratio of 0.80 indicates that the stock is trading at a discount to its book value, suggesting that the market values the company's tangible assets at less than their accounting value, a common characteristic for distressed or cyclical industrial firms. Alternative valuation metrics such as a price-to-sales ratio of 0.93 and an EV/EBITDA of -182.16 further underscore the lack of traditional profitability and suggest that the valuation is primarily driven by asset liquidation values or speculative hopes regarding future operational improvements. Price action analysis reveals a 52-week high of $8.17 and a 52-week low of $4.02, providing a range within which the stock has traded; without a specific current price provided in the source data, the valuation context remains dependent on the recovery of earnings to positive territory. The stock exhibits a beta of 1.11, which indicates that the share price is 11% more volatile than the broader market, meaning that investors face amplified risk exposure to general market swings, particularly within the industrial and energy sectors.
Growth & Income
Growth dynamics for the company are currently negative, with revenue growth year-over-year standing at -25.0% and earnings growth year-over-year listed as N/A. The absence of earnings growth data combined with significant revenue contraction implies that the decline in sales has likely been severe enough to wipe out all profits, rather than a scenario where earnings are simply growing slower than revenue. Regarding income, the company does not pay dividends, evidenced by a dividend yield of N/A and a payout ratio of 0.0%, which means the company retains all earnings, albeit negative ones, for potential future reinvestment rather than distributing income to shareholders. This non-dividend profile forces investors to rely entirely on capital appreciation for returns, as there is no cash flow distribution to provide a cushion during periods of poor operational performance. The overall growth and income profile is characterized by a contractionary phase with no income support, highlighting a period of significant operational stress where the primary focus must be on reducing the massive cash burn and restoring profitability before any meaningful growth or income generation can resume.
同行比较
SEACOR Marine Holdings Inc. (SMHI) 在海运行业运营。以下是其与市值最接近的同行的比较:
| 公司 | 代码 | 市值 | 市盈率 |
|---|---|---|---|
| SEACOR Marine Holdings Inc. | SMHI | $194.31M | N/A |
| Kirby Corporation | KEX | $7.72B | 22.2 |
| Matson, Inc. | MATX | $5.58B | 13.7 |
| Hafnia Limited | HAFN | $4.17B | 12.5 |
海运行业平均市盈率为16.9倍。SEACOR Marine Holdings Inc.的市盈率为N/A。
本分析由AI生成,仅供参考,不构成投资建议。数据可能存在延迟或不准确。在做出投资决策之前,请务必进行自己的研究并咨询合格的财务顾问。
相关海运股票
Kirby Corporation
$7.72B
MATXMatson, Inc.
$5.58B
HAFNHafnia Limited
$4.17B
SBLKStar Bulk Carriers Corp.
$3.14B
ZIMZIM Integrated Shipping Services Ltd.
$3.04B
WTE.TOWestshore Terminals Investment Corporation
$2.54B
工业热门股票
Caterpillar Inc.
$418.47B
GEGE Aerospace
$328.59B
GEVGE Vernova Inc.
$287.66B
RTXRTX Corporation
$241.02B
BAThe Boeing Company
$172.56B
关于SEACOR Marine Holdings Inc.
SEACOR Marine Holdings Inc. provides marine and support transportation services to offshore energy facilities worldwide. The company engages in the operation and management of a fleet of offshore support vessels that deliver cargo and personnel to offshore installations, including offshore wind farms; assisting in offshore operations for production and storage facilities; and carrying and launching of equipment used underwater in drilling and well installation, maintenance, inspection and repair. It also provides construction, well work-over, offshore wind farm installation and decommissioning support services; emergency response services; and accommodations for technicians and specialists. As of December 31, 2025, the Company operated a fleet of 44 support vessels, of which all were owned. It serves integrated national and international oil companies, independent oil and natural gas exploration and production companies, and oil field service and construction companies, as well as offshore wind farm operators and offshore wind farm installation and maintenance companies. SEACOR Marine Holdings Inc. was founded in 1989 and is headquartered in Houston, Texas.
公司简介以英文显示。
访问官网 →