Protara Therapeutics, Inc. (TARA) 股票分析
医疗保健Protara Therapeutics, Inc.
$4.80
$-0.12 (-2.44%)
最后更新: 2026年5月26日
价格走势
暂无价格数据
分析
公司概述
Protara Therapeutics, Inc. operates as a clinical-stage biopharmaceutical company dedicated to advancing transformative therapies aimed at treating cancer and rare diseases. The company focuses its research and development efforts primarily on TARA-002, an investigational cell therapy currently undergoing Phase II clinical trials for the treatment of non-malignant conditions. This entity functions within the broader healthcare sector and the specific biotechnology industry, positioning itself as a specialized player in high-risk, high-reward therapeutic development. As of the latest reporting period, the company possesses a market capitalization of $282.32 million and employs a workforce of 46 individuals. The market capitalization figure indicates that Protara is classified as a micro-cap company, reflecting a small total market value relative to large-cap peers, while the absence of reported annual revenue underscores its status as a pre-revenue entity typical of early-stage biotechnology firms. The relatively modest employee count of 46 suggests a lean organizational structure, which is common for clinical-stage companies that must allocate limited human resources toward critical research milestones and clinical trial execution.
财务健康
Protara Therapeutics reported a net income of -$57,439,000 over the trailing twelve months, with an EBITDA of -$64,187,000, while revenue figures are not available for the trailing twelve months. The significant negative gap between revenue and net income reveals a cost structure dominated by research, development, and clinical trial expenses that far exceed any current product sales, a standard characteristic for clinical-stage biopharmaceutical companies. The company generated free cash flow of -$38,476,124, indicating a substantial cash outflow that limits immediate financial flexibility but is often necessary to fund long-term drug development pipelines. All three margin metrics—gross margin, operating margin, and profit margin—are recorded at 0.0%, which indicates that the company has not yet achieved profitability and that its revenue, if any, is fully consumed by direct costs and operational expenses. The balance sheet shows a cash balance of $155.55 million against total debt of $3.36 million, resulting in a debt-to-equity ratio of 1.71. This comparison suggests a balance sheet that is heavily reliant on equity financing rather than leverage, as the cash reserves significantly outweigh the debt obligations despite the elevated debt-to-equity metric. The current ratio stands at 14.58, which indicates an extremely strong short-term liquidity position, providing the company with ample resources to meet its short-term obligations and continue funding its clinical programs. Furthermore, the return on equity is -31.6% and the return on assets is -20.6%, metrics that reveal that management effectiveness in generating profit from the equity base and total assets is currently negative due to ongoing investment losses.
估值评估
The trailing twelve-month P/E ratio is not available due to the lack of net income, while the forward P/E ratio is reported at -3.75. The negative forward P/E implies that the market anticipates continued negative earnings in the near future, which is typical for companies in the development phase that have not yet reached commercialization. The price-to-book ratio is 1.42, indicating that the market values the company at a premium of 42% over its net asset value, suggesting that investors are pricing in significant future value from the drug pipeline. Price-to-sales and EV/EBITDA metrics are also not applicable or negative, with the EV/EBITDA standing at -2.03, reflecting the company's inability to generate positive earnings relative to enterprise value. The stock's 52-week high is $7.82 and its 52-week low is $2.77; without a specific current price provided in the data, the valuation can only be contextualized by this wide trading range which demonstrates significant volatility. The beta value is 1.50, meaning the stock is expected to be 50% more volatile than the broader market, indicating that price movements will likely amplify market swings. These valuation metrics collectively paint a picture of a high-risk asset where traditional profitability-based valuations are not yet functional.
Growth & Income
Revenue growth year-over-year and earnings growth year-over-year are both not available, which precludes a direct comparison of the rates at which earnings and revenue are growing. Consequently, it is impossible to determine from the provided data whether earnings are growing faster or slower than revenue, as neither metric has a positive historical baseline for calculation. The company does not pay a dividend, evidenced by a dividend yield of N/A and a payout ratio of 0.0%. Since there are no earnings available to distribute, the payout ratio is unsustainable in the traditional sense, but rather reflects a corporate strategy of reinvesting all available capital back into research and development to advance clinical trials. For non-dividend payers like Protara, the lack of dividend yield confirms that the company retains earnings to fund its growth initiatives rather than returning cash to shareholders. The overall growth and income profile is characterized by zero current income distribution and undefined growth rates until the company transitions from clinical trials to commercial product launches.
同行比较
Protara Therapeutics, Inc. (TARA) 在生物技术行业运营。以下是其与市值最接近的同行的比较:
| 公司 | 代码 | 市值 | 市盈率 |
|---|---|---|---|
| Protara Therapeutics, Inc. | TARA | $269.78M | N/A |
| Vertex Pharmaceuticals Incorporated | VRTX | $110.64B | 25.8 |
| Regeneron Pharmaceuticals, Inc. | REGN | $66.98B | 15.6 |
| argenx SE | ARGX | $50.52B | 36.0 |
生物技术行业平均市盈率为53.8倍。Protara Therapeutics, Inc.的市盈率为N/A。
本分析由AI生成,仅供参考,不构成投资建议。数据可能存在延迟或不准确。在做出投资决策之前,请务必进行自己的研究并咨询合格的财务顾问。
相关生物技术股票
Vertex Pharmaceuticals Incorporated
$110.64B
REGNRegeneron Pharmaceuticals, Inc.
$66.98B
ARGXargenx SE
$50.52B
ALNYAlnylam Pharmaceuticals, Inc.
$39.45B
RVMDRevolution Medicines, Inc.
$32.93B
ONCBeOne Medicines AG
$32.19B
医疗保健热门股票
Eli Lilly and Company
$949.47B
JNJJohnson & Johnson
$554.09B
ABBVAbbVie Inc.
$376.54B
UNHUnitedHealth Group Incorporated
$342.24B
MRKMerck & Co., Inc.
$302.33B
关于Protara Therapeutics, Inc.
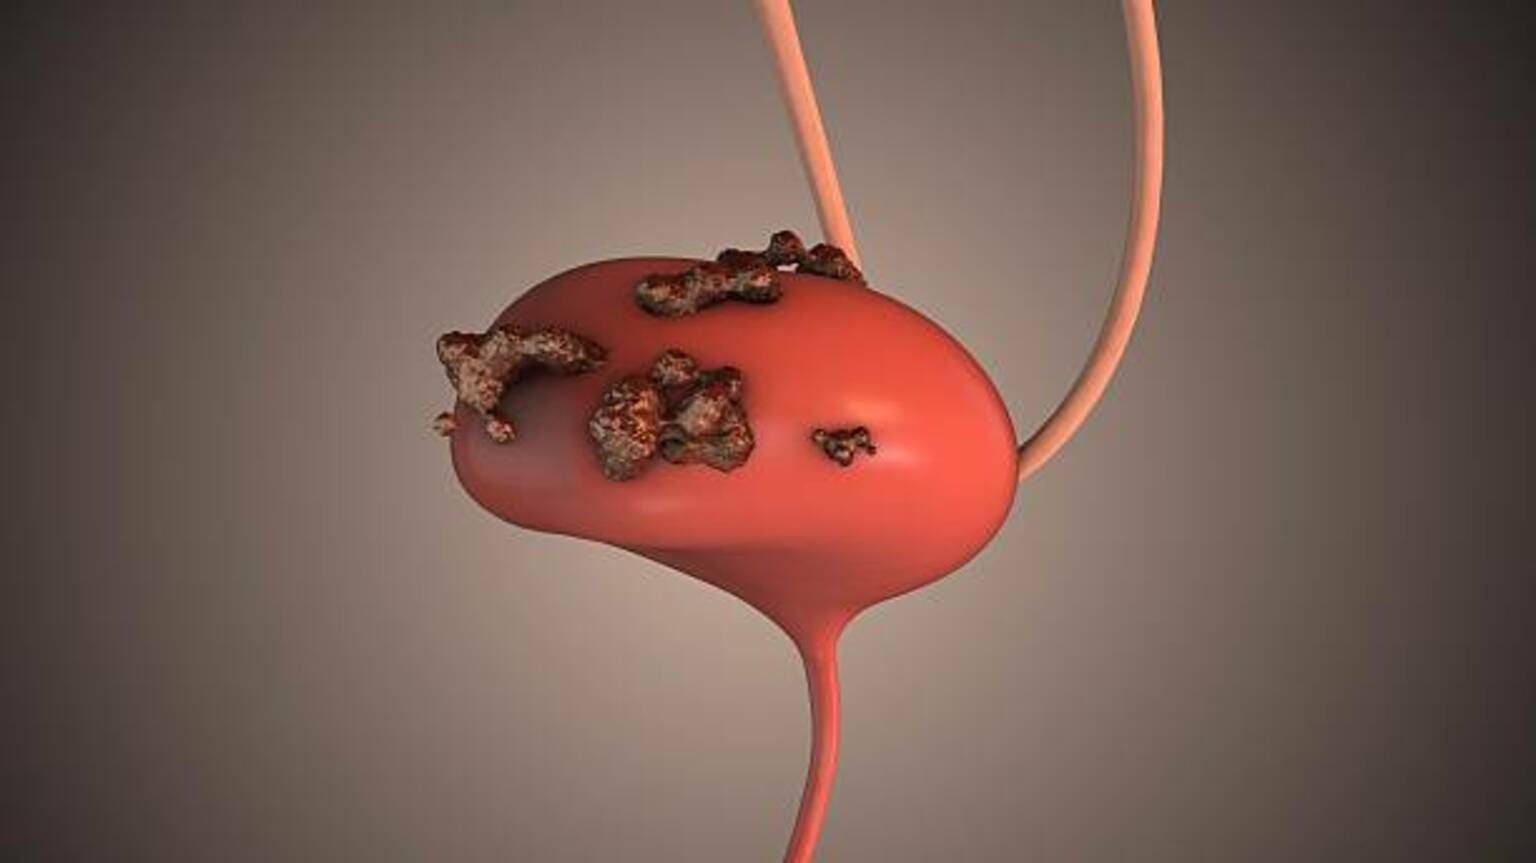
Protara Therapeutics, Inc., a clinical-stage biopharmaceutical company, engages in advancing transformative therapies for the treatment of cancer and rare diseases. The company's lead program is TARA-002, an investigational cell therapy, which is in Phase II clinical trial for the treatment of non-muscle invasive bladder cancer and lymphatic malformations. It is also developing intravenous choline chloride, an investigational phospholipid substrate replacement therapy for patients receiving parenteral nutrition and fluids. The company is headquartered in New York, New York.
公司简介以英文显示。
访问官网 →