Omega Flex, Inc. (OFLX) 股票分析
工业Omega Flex, Inc.
$30.31
+$0.70 (+2.36%)
最后更新: 2026年5月26日
价格走势
暂无价格数据
分析
公司概述
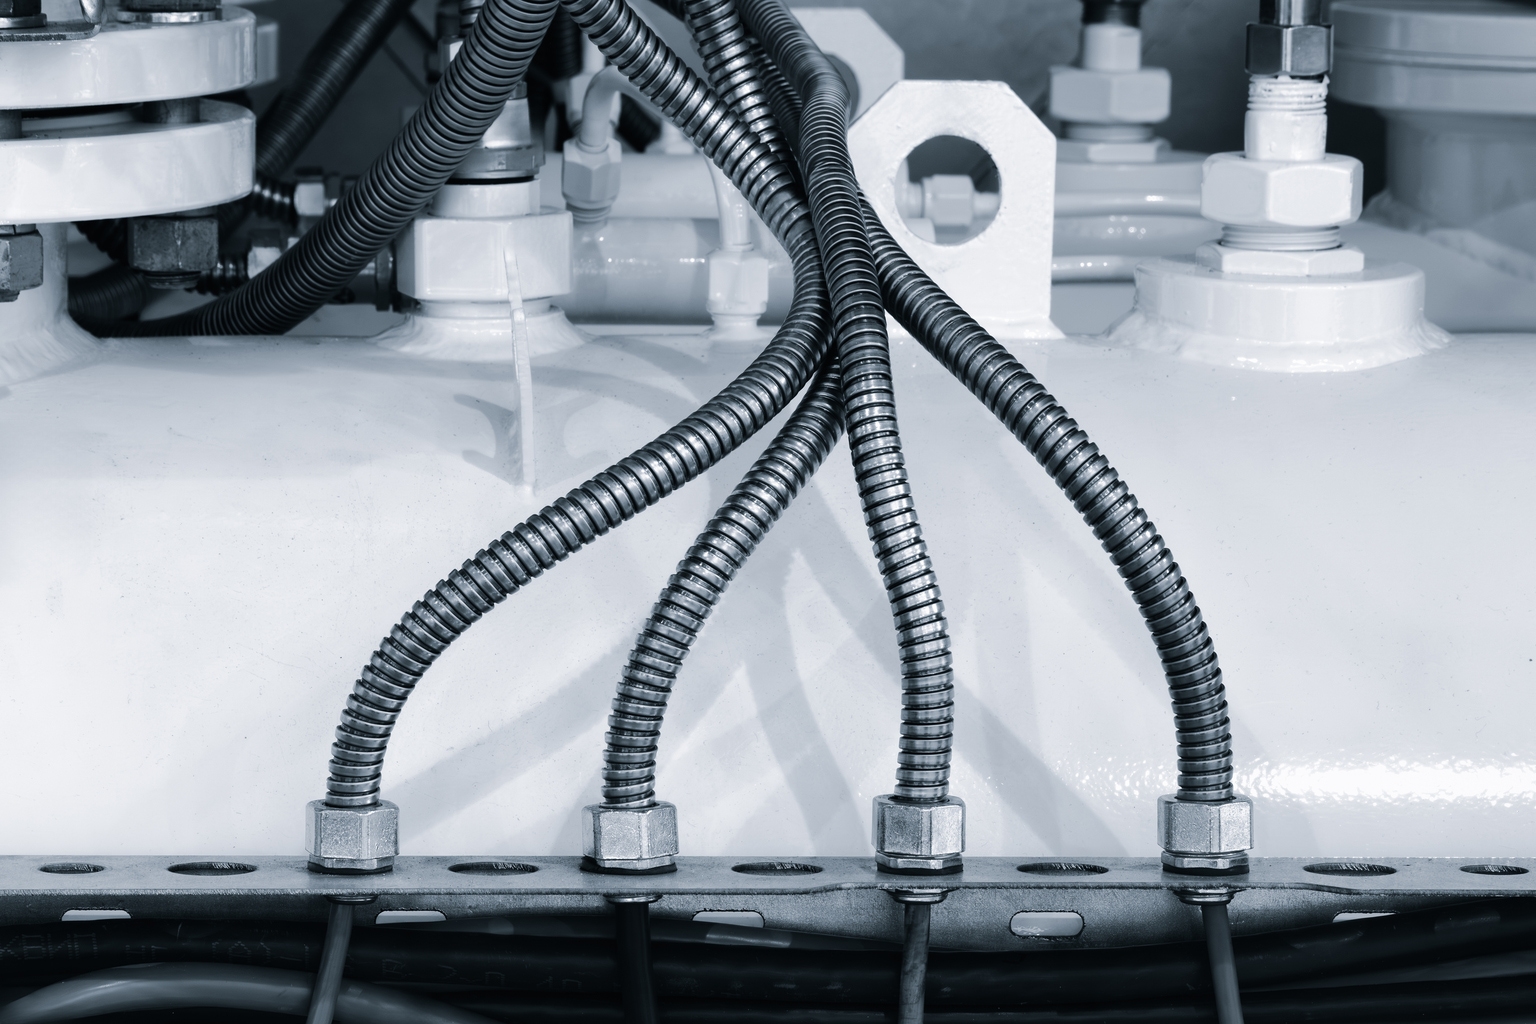
Omega Flex, Inc. operates within the Industrials sector as a key player in the Specialty Industrial Machinery industry, focusing on the manufacturing and distribution of flexible metal hoses, fittings, and accessories. Its product portfolio specifically includes flexible gas piping for residential and commercial applications, various fittings, containment piping, and corrugated copper tubing utilized in hospital settings, serving markets across the United States, Canada, and internationally. The company demonstrates a mid-sized market presence with a total market capitalization of $299.70 million and an annual trailing twelve-month revenue of $98.30 million. With an employee base of 172, the firm's scale reflects a specialized operational footprint rather than broad industrial dominance, positioning it as a niche manufacturer where revenue generation is tightly coupled with specific industrial demand cycles. The market cap figure of $299.70 million combined with revenue of $98.30 million suggests a valuation that assigns a multiple to its earnings, indicating market recognition of its specialized machinery capabilities despite its relatively modest workforce size.
财务健康
The company reported a trailing twelve-month revenue of $98.30 million, which resulted in a net income of $14.83 million and an EBITDA of $18.29 million. The gap between the revenue figure and net income reveals a significant cost structure where approximately 84.9% of revenue is consumed by operating expenses before interest and taxes, leaving the remaining portion for profit generation. Free cash flow stands at $10.87 million, indicating that the company generates substantial cash from operations after capital expenditures, which provides a buffer for financial flexibility and potential debt servicing. Profitability is further detailed by three key margin metrics: a gross margin of 60.0%, an operating margin of 15.8%, and a profit margin of 15.1%. The high gross margin of 60.0% indicates strong pricing power or low cost of goods sold relative to sales, while the operating and profit margins show that overhead costs and taxes consume a notable portion of the gross profit. On the balance sheet, the company holds $53.23 million in cash against $4.76 million in debt, resulting in a conservative financial structure characterized by a net cash position. This liquidity is supported by a debt-to-equity ratio of 5.66, which, despite the seemingly high leverage figure, is mitigated by the substantial cash reserves, effectively lowering the net debt burden. Short-term liquidity is exceptionally robust, evidenced by a current ratio of 5.20, suggesting the firm possesses more than five times the current assets needed to cover its current liabilities. Return metrics highlight management effectiveness with a return on equity of 17.4% and a return on assets of 10.0%, demonstrating that the company generates efficient returns on the capital invested by shareholders and deployed across its asset base.
估值评估
Valuation multiples provide insight into market expectations, with a trailing P/E ratio of 20.20 and a forward P/E ratio listed as N/A. The absence of a forward P/E figure implies that analysts or the market currently lack sufficient data to project future earnings per share, or the company does not issue analyst forecasts typical for large-cap firms. The price-to-book ratio is 3.56, indicating that the stock trades at a significant premium over its book value, which may reflect intangible assets, brand value, or expectations of future growth that are not captured on the balance sheet. Alternative valuation metrics include a price-to-sales ratio of 3.05 and an EV/EBITDA of 13.72, suggesting the market values the company at roughly three times its sales and nearly fourteen times its adjusted earnings before interest, taxes, depreciation, and amortization. Price volatility is contextualized by the 52-week high of $39.64 and the 52-week low of $25.58, with the current trading price situated within this range but below the recent peak. The beta value of 0.45 indicates that the stock's price movements are roughly half as volatile as the broader market, suggesting it may serve as a lower-risk component in a diversified portfolio relative to high-beta industrial peers.
Growth & Income
Growth dynamics reveal a contractionary phase with revenue growth of -6.5% year-over-year and earnings growth of -27.1% year-over-year. The disparity between these two figures indicates that earnings are declining at a significantly faster rate than revenue, implying that the company is facing rising costs or margin compression that are outpacing its top-line decline. As a dividend payer, the company offers a dividend yield of 4.6% with a payout ratio of 92.5%, a level that requires close monitoring as it exceeds the 90% threshold often considered high relative to fluctuating earnings. The high payout ratio combined with negative earnings growth suggests that the dividend sustainability is challenged, as the company is distributing a large portion of its current profits while shrinking its net income base. Overall, the company presents a profile characterized by current income generation through a high yield but faces headwinds in growth metrics that could impact future dividend coverage and capital allocation strategies.
同行比较
Omega Flex, Inc. (OFLX) 在特种工业机械行业运营。以下是其与市值最接近的同行的比较:
| 公司 | 代码 | 市值 | 市盈率 |
|---|---|---|---|
| Omega Flex, Inc. | OFLX | $305.96M | 22.8 |
| GE Vernova Inc. | GEV | $287.66B | 31.3 |
| Eaton Corporation plc | ETN | $156.54B | 39.4 |
| Parker-Hannifin Corporation | PH | $109.31B | 31.9 |
特种工业机械行业平均市盈率为43.6倍。Omega Flex, Inc.的市盈率为22.8。
本分析由AI生成,仅供参考,不构成投资建议。数据可能存在延迟或不准确。在做出投资决策之前,请务必进行自己的研究并咨询合格的财务顾问。
相关特种工业机械股票
GE Vernova Inc.
$287.66B
ETNEaton Corporation plc
$156.54B
PHParker-Hannifin Corporation
$109.31B
CMICummins Inc.
$92.28B
EMREmerson Electric Co.
$78.96B
ITWIllinois Tool Works Inc.
$72.04B
工业热门股票
Caterpillar Inc.
$418.47B
GEGE Aerospace
$328.59B
RTXRTX Corporation
$241.02B
BAThe Boeing Company
$172.56B
UNPUnion Pacific Corporation
$160.96B
关于Omega Flex, Inc.
Omega Flex, Inc. manufactures and sells flexible metal hoses, fittings, and accessories in the United States, Canada, and internationally. It offers flexible gas piping for use in residential and commercial buildings; fittings; containment pining; and corrugated copper tubing for use in hospitals, ambulatory care centers, dental, physician and veterinary clinics, laboratories, and other facilities. The company sells its products under the TracPipe CSST, CounterStrike CSST, AutoFlare, DoubleTrac, DEF-Trac, and MediTrac brand names. It serves various markets, including construction, manufacturing, transportation, petrochemical, pharmaceutical, and other industries. The company sells its products through independent sales representatives, distributors, wholesalers, original equipment manufacturers, and direct sales, as well as through its website. The company was formerly known as Tofle America, Inc. and changed its name to Omega Flex, Inc. in 1996. Omega Flex, Inc. was incorporated in 1975 and is based in Exton, Pennsylvania.
公司简介以英文显示。
访问官网 →