NYSE · Costruzioni Residenziali · USD
Dream Finders Homes, Inc. (DFH) Analisi del titolo
Dream Finders Homes, Inc. (DFH) è un'azione del settore Costruzioni Residenziali quotata su NYSE e negoziata in dollaro statunitense.
Ultimo aggiornamento: 21 ottobre 2026
Storico Prezzi
Nessun dato sui prezzi disponibile
Passa il mouse per vedere la chiusura giornaliera. La linea tratteggiata indica l'apertura del periodo.
Statistiche chiave di DFH
Dati al 21 ott 2026Negoziazione
- Apertura
- 9,49 $
- Chiusura precedente
- 9,59 $
- Intervallo del giorno
- 8,97–9,53
- Intervallo 52 settimane
- 7,30–23,80
- Volume
- 1,80 Mln
- BetaQuanto il titolo si muove rispetto al mercato. 1,0 segue il mercato; sopra oscilla di più, sotto di meno.
- 1,90
Valutazione
- Capitalizzazione
- 816,63 Mln $
- Rapporto P/E
- 6,35
- P/E prospetticoPrezzo dell'azione diviso per l'utile atteso del prossimo anno, non di quello trascorso.
- 11,49
- Rapporto P/SValore di mercato diviso per i ricavi annui. Utile per società non ancora redditizie, dove il P/E non esiste.
- 0,20
- EPS (12 m)Utile attribuibile a ciascuna azione negli ultimi dodici mesi.
- 1,42
Bilancio (esercizio)
- Ricavi (esercizio)
- 4,32 Mld $−2,85%
- Utile netto (esercizio)
- 217,20 Mln $−35,23%
- Margine di profittoQuota dei ricavi che resta come utile dopo costi e imposte.
- 3,55%
- Azioni in circolazione
- 32,81 Mln
- Rendimento 1 anno
- −61,25%
Dividendo e date
- Data dei risultati
- 29 ottobre 2026stimata
- Volume Medio
- 1,04 Mln
Sono mostrati solo gli indicatori che la società riporta. Dati forniti da Yahoo Finance tramite yfinance. Aggiornato quotidianamente.
Dati chiave
Al 21 ottobre 2026, DFH ha chiuso a 9,02 $, −61,25% su 1 anno.
Dream Finders Homes, Inc. (DFH) ha una capitalizzazione di mercato di 816,63 Mln $.
Nell'esercizio 2025, DFH ha registrato ricavi di 4,32 Mld $.
Rendimento di DFH per anno solare
Rendimento di Dream Finders Homes, Inc. (DFH) da gen 2021: che cosa sono diventati 10.000 $
- 1 anno
- 10.000 $ 3875 $
- −61,25%
- 5 anni
- 10.000 $ 5392 $
- −46,08%
- Da gen 2021
- 10.000 $ 4305 $
- −56,95%
Se avessi investito 10.000 $ in Dream Finders Homes, Inc. (DFH) alla chiusura del 21 gennaio 2021, la prima chiusura registrata qui, l'investimento varrebbe 4305 $ alla chiusura del 21 ottobre 2026: −56,95% in totale, −13,64% all'anno, su un periodo parziale inferiore a 10 anni. Calcolo storico sui prezzi di chiusura rettificati per frazionamenti e dividendi, al lordo di commissioni e imposte.
Rendimenti per anno solare calcolati sui prezzi di chiusura giornalieri. Gli anni parziali sono mostrati attenuati e contrassegnati con un asterisco.
| Anno | Rendimento |
|---|---|
| 2026 (anno parziale) | −47,25% |
| 2025 | −26,51% |
| 2024 | −34,51% |
| 2023 | +310,28% |
| 2022 | −55,48% |
| 2021 | −7,16% |
Dati al 21 ottobre 2026.
Ricavi e utili di DFH per esercizio
Chiusura esercizio: dicembre| Esercizio | Ricavi | Utile netto | Margine netto |
|---|---|---|---|
| 2025 | 4,32 Mld $ | 217,20 Mln $ | 5,0% |
| 2024 | 4,45 Mld $ | 335,34 Mln $ | 7,5% |
| 2023 | 3,75 Mld $ | 295,90 Mln $ | 7,9% |
| 2022 | 3,34 Mld $ | 262,31 Mln $ | 7,8% |
| Esercizio | Ricavi | Utile lordo | Reddito operativo | Utile netto | Margine netto |
|---|---|---|---|---|---|
| 2025 | 4,32 Mld $ | 754,77 Mln $ | 269,55 Mln $ | 217,20 Mln $ | 5,0% |
| 2024 | 4,45 Mld $ | 827,93 Mln $ | 432,83 Mln $ | 335,34 Mln $ | 7,5% |
| 2023 | 3,75 Mld $ | 730,77 Mln $ | 427,98 Mln $ | 295,90 Mln $ | 7,9% |
| 2022 | 3,34 Mld $ | 615,22 Mln $ | 349,16 Mln $ | 262,31 Mln $ | 7,8% |
Dati annuali come riportati, nella valuta di bilancio della società. Dati al 31 dicembre 2025.
Valutazione di DFH rispetto alla mediana Costruzioni Residenziali
Mediana su 19 azioni| Indicatore | DFH | Mediana Costruzioni Residenziali | Rispetto alla mediana |
|---|---|---|---|
| P/E | 6,35 | 12,96 | 51% sotto |
| Rapporto P/S | 0,20 | 1,16 | 0,2x la mediana |
| Margine di profitto | 3,55% | 7,30% | 3,8 p.p. sotto |
Mediane su 19 azioni Costruzioni Residenziali che riportano l'indicatore. Mediane, non medie, così un valore anomalo non le sposta. Dati al 21 ottobre 2026.
Ultime Notizie
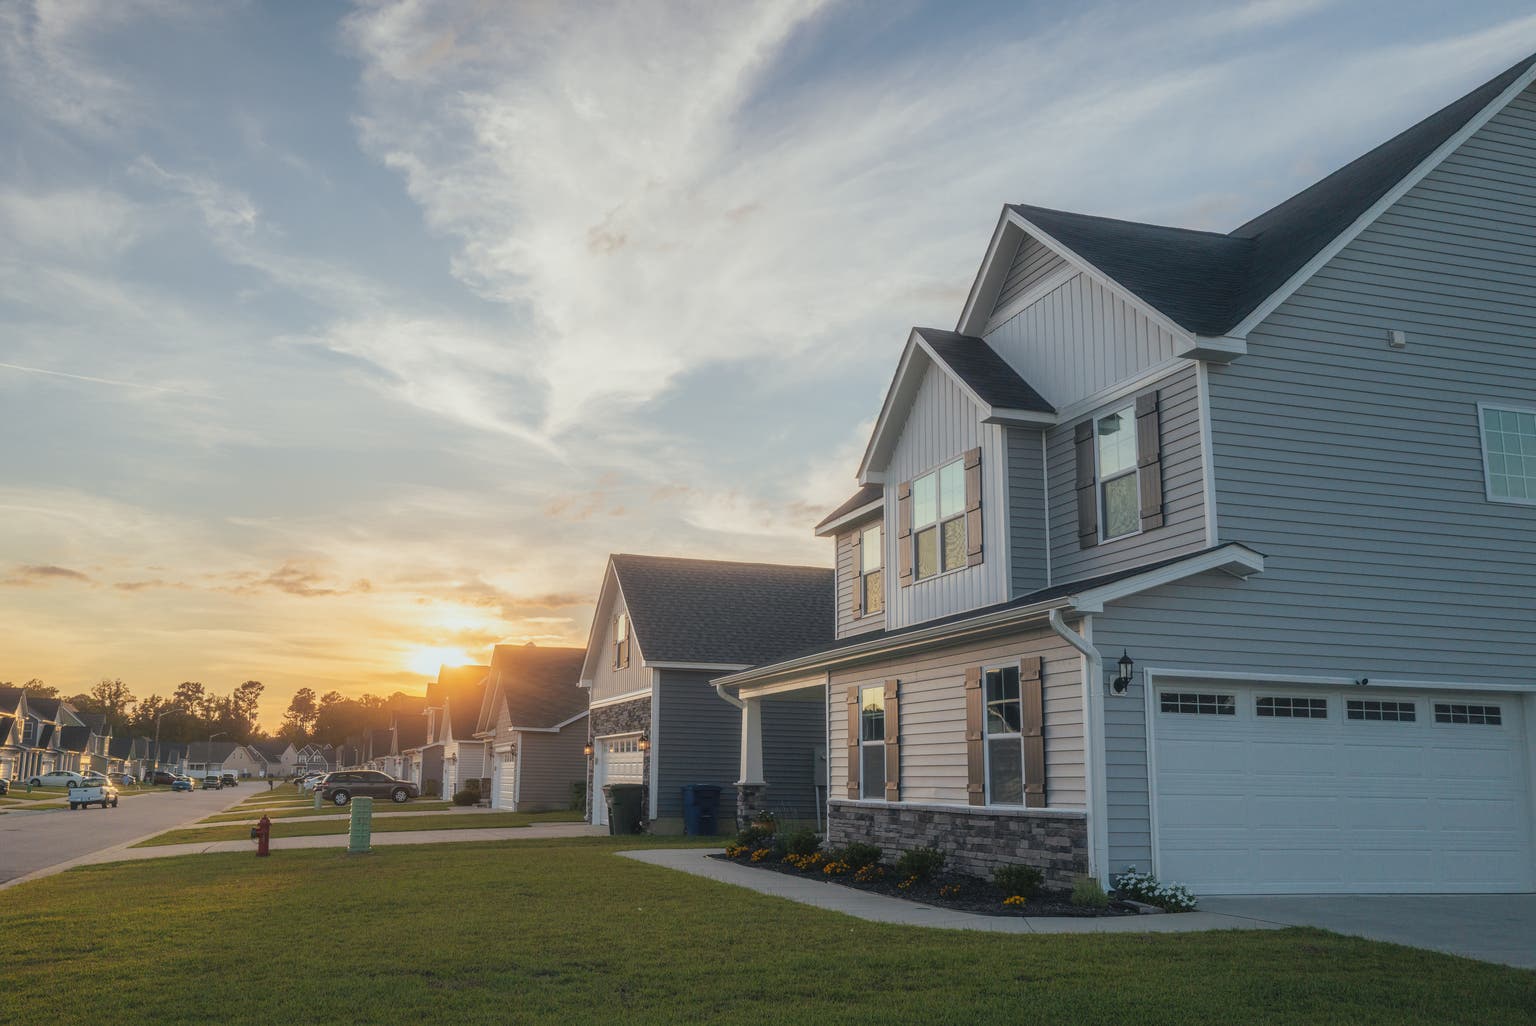
Builders FirstSource, Dream Finders Homes Highlight Pain For Homebuilders
SeekingAlphaS&P downgrades Dream Finders to ’B+’ following $2.2B acquisition of Beazer Homes
YahooDream Finders Homes Completes Acquisition of Beazer Homes
YahooBeazer Homes Stockholders Overwhelmingly Vote to Approve Dream Finders’ Acquisition of Beazer Homes
YahooDream Finders Homes Stock in Focus as Bear Cave Flags CEO's Pledged Shares
BenzingaWatching Dream Finders Homes; The Bear Cave By Hunterbrook Media Issues Report On Co Titled "Problems at Dream Finders Homes (DFH)"; Reports Hunterbrook Capital Is Short $MRP, $LEN And Long A Basket Of Comparable Securities
Benzinga





Tutti i 17 articoli ↓Mostra meno ↑
Dream Finders Homes, Inc. Announces Results of Consent Solicitation for Beazer Homes USA, Inc.’s 8.000% Senior Notes Due 2032
YahooDream Finders Announces Results of Consent Solicitations for Beazer’s 7.500% Senior Notes Due 2031 and 8.000% Senior Notes Due 2032 and Amendment and Extension of Consent Solicitation with Respect to 8.000% Senior Notes Due 2032
YahooDream Finders Homes, Inc. Announces Consent Solicitation for 7.500% Senior Notes Due 2031 and 8.000% Senior Notes Due 2032 of Beazer Homes USA, Inc.
YahooDream Finders Homes (DFH) Price Target Increased by 14.29% to 24.48
FintelDream Finders Homes And Beazer Homes USA Tie The Knot (Downgrade)
SeekingAlphaDream Finders: The Beazer Acquisition Adds Unnecessary Risk (Rating Downgrade)
SeekingAlphaMillrose Properties To Provide Financing Of Up To $1.25B In Support Of Dream Finders Homes' Acquisition Of Beazer Homes
BenzingaBeazer Discloses Fee Payable To Dream Finder Homes In Event Of Merger Termination Of $31.M
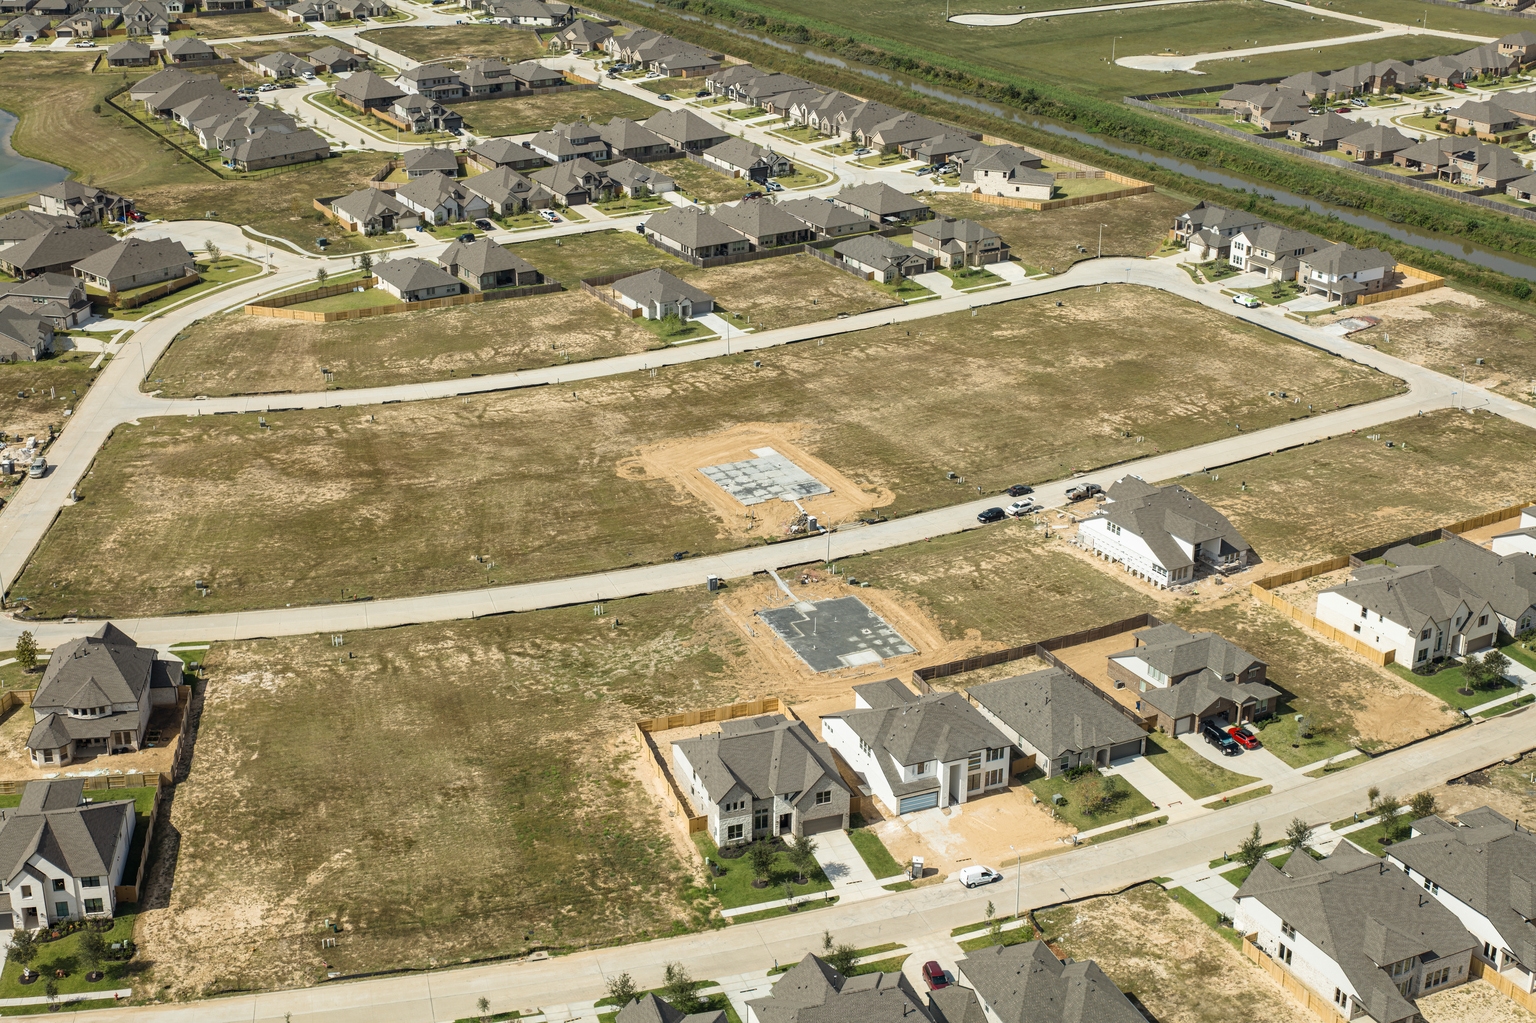
BenzingaDream Finders Homes To Acquire Beazer Homes For $33.50 Per Share In Cash At EV Of ~$2.2B; Expected To Generate Significant Synergies And Be Double-Digit Percentage EPS Accretive In Year One
BenzingaDream Finders Homes Announces Second Quarter 2026 Results
YahooDream Finders Homes Q2 EPS $0.27 Misses $0.29 Estimate, Sales $1.063B Beat $1.023B Estimate
Benzinga







Notizie fornite da fonti di terze parti. Non costituisce consulenza finanziaria.
Analisi
Derivato dai datiOgni cifra riportata sopra è letta dai dati propri di questa pagina a ogni ricostruzione giornaliera. Solo a scopo informativo, non costituisce consulenza finanziaria. Dati al 21 ottobre 2026.
Azioni Costruzioni Residenziali Correlate
D.R. Horton, Inc.
38,87 Mld $
PHMPulteGroup, Inc.
21,50 Mld $
LENLennar Corporation
18,48 Mld $
NVRNVR, Inc.
15,80 Mld $
TOLToll Brothers, Inc.
12,44 Mld $
IBPInstalled Building Products, Inc.
4,99 Mld $
Azioni popolari Consumo Ciclico
Amazon.com, Inc.
2,83 Bln $
TSLATesla, Inc.
1,53 Bln $
HDThe Home Depot, Inc.
313,41 Mld $
BABAAlibaba Group Holding Limited
270,19 Mld $
TMToyota Motor Corporation
229,51 Mld $