NYSE · Arzneimittelhersteller - Spezial & Generika · USD
Emergent BioSolutions Inc. (EBS) Aktienanalyse
Emergent BioSolutions Inc. (EBS) ist eine Arzneimittelhersteller - Spezial & Generika-Aktie, die an der NYSE notiert und in US-Dollar gehandelt wird.
Zuletzt aktualisiert: 21. Oktober 2026
Kursverlauf
Keine Kursdaten verfügbar
Bewegen Sie den Mauszeiger für den Tagesschlusskurs. Die gepunktete Linie markiert den Eröffnungskurs des Zeitraums.
EBS Kennzahlen
Stand: 21. Okt. 2026Handel
- Eröffnung
- 6,30 $
- Vorheriger Schluss
- 6,29 $
- Tagesspanne
- 6,15–6,38
- 52-Wochen-Spanne
- 4,36–14,06
- Volumen
- 851.592,00
- BetaWie stark sich der Kurs im Vergleich zum Gesamtmarkt bewegt. 1,0 entspricht dem Markt, darüber schwankt stärker, darunter schwächer.
- 2,29
Bewertung
- Marktkapitalisierung
- 317,89 Mio. $
- KGV
- nicht profitabel
- KGV (erwartet)Aktienkurs geteilt durch den erwarteten Gewinn des kommenden Jahres statt des vergangenen.
- 5,92
- PEG-VerhältnisDas KGV geteilt durch das erwartete Gewinnwachstum. Setzt ein hohes KGV ins Verhältnis zum Wachstumstempo.
- 0,38
- KUVMarktwert geteilt durch den Jahresumsatz. Nützlich bei noch nicht profitablen Unternehmen ohne berechenbares KGV.
- 0,41
- EPS (12 M)Auf jede Aktie entfallender Gewinn der letzten zwölf Monate.
- −3,40
Finanzen (GJ)
- Umsatz (GJ)
- 705,20 Mio. $−30,43 %
- Nettogewinn (GJ)
- 52,60 Mio. $
- GewinnmargeAnteil des Umsatzes, der nach allen Kosten und Steuern als Gewinn bleibt.
- −22,96 %
- Ausstehende Aktien
- 51,27 Mio.
- Rendite 1 Jahr
- −34,39 %
Dividende und Termine
- Termin Quartalszahlen
- 2. November 2026
- Durchschn. Volumen
- 1,20 Mio.
Es werden nur Kennzahlen angezeigt, die das Unternehmen ausweist. Daten bereitgestellt von Yahoo Finance über yfinance. Täglich aktualisiert.
Wichtige Fakten
Zum 21. Oktober 2026 schloss EBS bei 6,20 $, −34,39 % über 1 Jahr.
Emergent BioSolutions Inc. (EBS) hat eine Marktkapitalisierung von 317,89 Mio. $.
Im Geschäftsjahr 2025 erzielte EBS einen Umsatz von 705,20 Mio. $.
EBS Rendite nach Kalenderjahr
Rendite von Emergent BioSolutions Inc. (EBS) über 10 Jahre: Was aus 10.000 $ wurde
- 1 Jahr
- 10.000 $ 6.561 $
- −34,39 %
- 5 Jahre
- 10.000 $ 1.226 $
- −87,74 %
- 10 Jahre
- 10.000 $ 2.203 $
- −77,97 %
Hätten Sie vor 10 Jahren, zum Schlusskurs vom 21. Oktober 2016, 10.000 $ in Emergent BioSolutions Inc. (EBS) investiert, wären daraus 2.203 $ geworden, zum Schlusskurs vom 21. Oktober 2026: insgesamt −77,97 %, −14,04 % pro Jahr. Historische Berechnung aus split- und dividendenbereinigten Schlusskursen, vor Gebühren und Steuern.
Kalenderjahresrenditen aus täglichen Schlusskursen berechnet. Teiljahre werden ausgegraut dargestellt und mit einem Sternchen gekennzeichnet.
| Jahr | Rendite |
|---|---|
| 2026 (Teiljahr) | −49,84 % |
| 2025 | +29,29 % |
| 2024 | +298,33 % |
| 2023 | −79,68 % |
| 2022 | −72,83 % |
| 2021 | −51,48 % |
| 2020 | +66,08 % |
| 2019 | −8,99 % |
| 2018 | +27,57 % |
| 2017 | +41,50 % |
| 2016 (Teiljahr) | +10,31 % |
Stand: 21. Oktober 2026.
EBS Umsatz und Ergebnis nach Geschäftsjahr
GJ endet Dezember| Geschäftsjahr | Umsatz | Nettogewinn | Nettomarge |
|---|---|---|---|
| 2025 | 705,20 Mio. $ | 52,60 Mio. $ | 7,5 % |
| 2024 | 1,01 Mrd. $ | −190,60 Mio. $ | −18,8 % |
| 2023 | 1,02 Mrd. $ | −760,50 Mio. $ | −74,3 % |
| 2022 | 1,08 Mrd. $ | −211,60 Mio. $ | −19,7 % |
| Geschäftsjahr | Umsatz | Bruttogewinn | Betriebsergebnis | Nettogewinn | Nettomarge |
|---|---|---|---|---|---|
| 2025 | 705,20 Mio. $ | 379,00 Mio. $ | 112,30 Mio. $ | 52,60 Mio. $ | 7,5 % |
| 2024 | 1,01 Mrd. $ | 332,30 Mio. $ | −81,50 Mio. $ | −190,60 Mio. $ | −18,8 % |
| 2023 | 1,02 Mrd. $ | 317,60 Mio. $ | −201,50 Mio. $ | −760,50 Mio. $ | −74,3 % |
| 2022 | 1,08 Mrd. $ | 383,00 Mio. $ | −163,30 Mio. $ | −211,60 Mio. $ | −19,7 % |
Jahreszahlen wie berichtet, in der Berichtswährung des Unternehmens. Stand: 31. Dezember 2025.
EBS Bewertung gegenüber dem Arzneimittelhersteller - Spezial & Generika-Median
Median aus 97 Aktien| Kennzahl | EBS | Arzneimittelhersteller - Spezial & Generika-Median | Zum Median |
|---|---|---|---|
| KUV | 0,41 | 2,10 | 0,2x der Median |
| Gewinnmarge | −22,96 % | −8,14 % | 14,8 Pp. darunter |
Mediane über 97 Arzneimittelhersteller - Spezial & Generika-Aktien, die die Kennzahl ausweisen. Mediane statt Durchschnitte, damit ein Ausreißer sie nicht verzerrt. Stand: 21. Oktober 2026.
Aktuelle Nachrichten
Emergent BioSolutions stock falls as CFO plans retirement
YahooEmergent BioSolutions Announces Retirement of Chief Financial Officer Richard S. Lindahl
YahooEmergent Biosolutions Appoints Treasurer Frank Vargo As Interim CFO, Effective Jan. 1, 2027, Succeeding Richard Lindahl
BenzingaEmergent BioSolutions to Report Third Quarter 2026 Financial Results on November 2, 2026
YahooEmergent Biosolutions (EBS) Soars 14.4%: Is Further Upside Left in the Stock?
YahooNVAX, EBS, ARCT, MRNA Rally After Russia Plague Lab Worker's Death: Retail Traders Eye 'Contract Awards'
Stocktwits





Alle 20 Artikel ↓Weniger anzeigen ↑
Media Advisory: Emergent to Host Ribbon Cutting Ceremony at Canton Manufacturing Facility
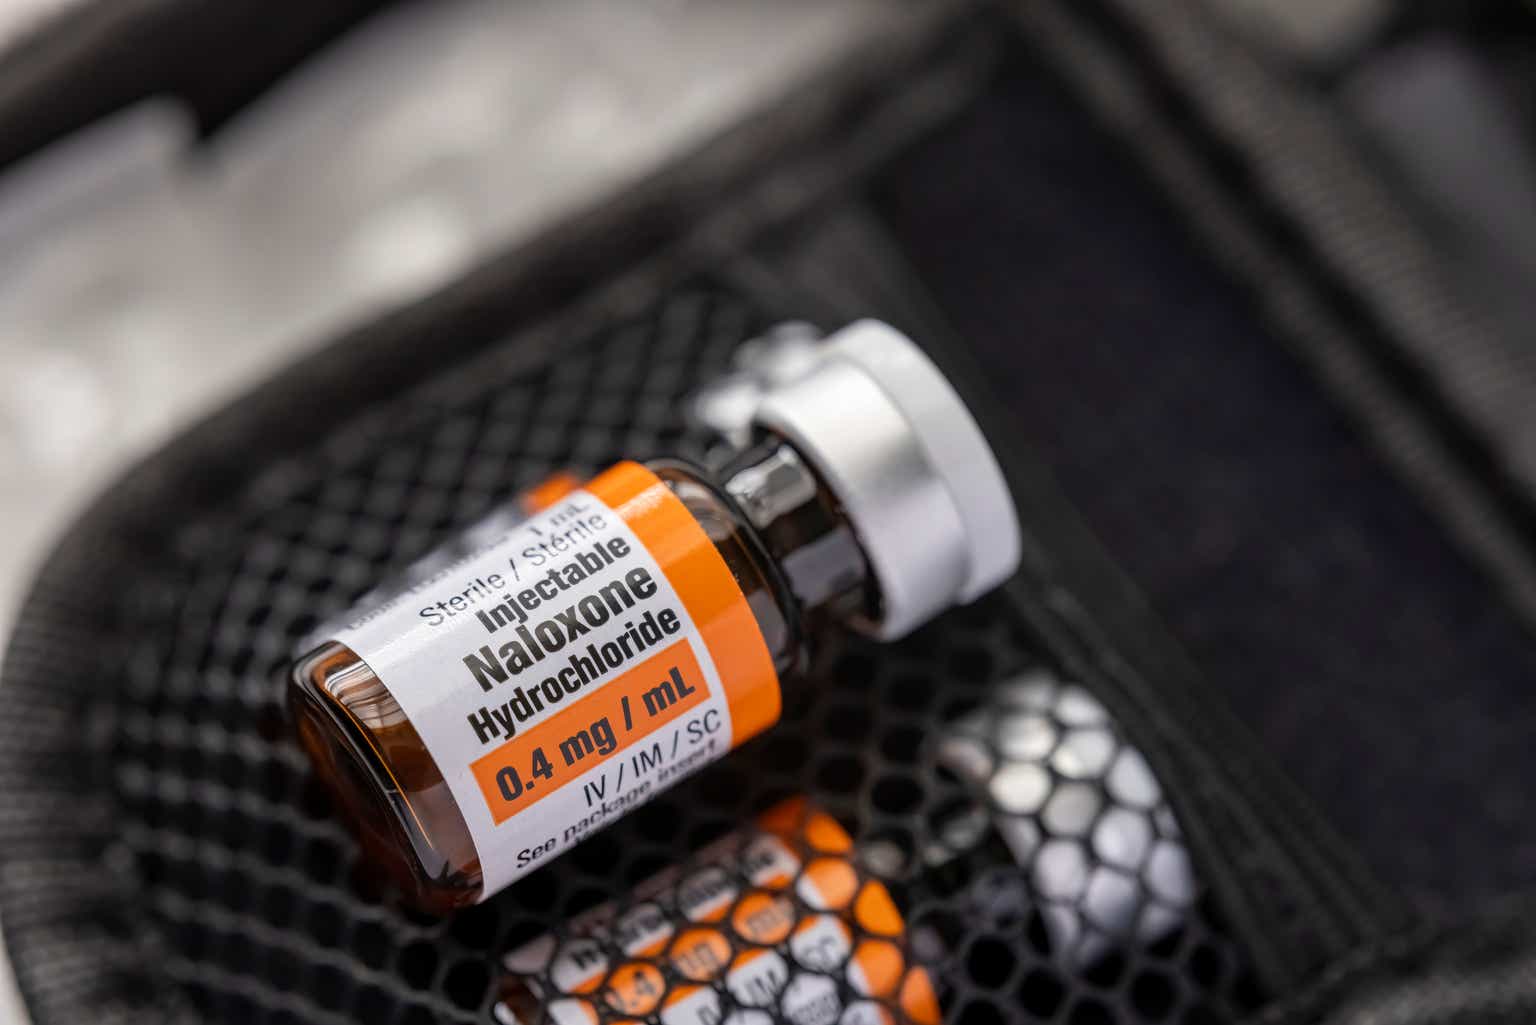
YahooEmergent: The MCM Engine Runs, But Naloxone Is Breaking Down
SeekingAlphaHC Wainwright & Co. Reiterates Buy on Emergent BioSolutions, Maintains $10 Price Target
BenzingaVaccines Global Market Intelligence Report 2026-2035 Featuring Bio Farma, Emergent BioSolutions, GC Pharma, GlaxoSmithKline, Janssen, Merck, Novavax, Moderna, Pfizer, Sanofi Pasteur, and Valneva
YahooEmergent BioSolutions - Tough 2026 Outlook Warrant Rating Downgrade
SeekingAlphaEmergent BioSolutions Completes Repurchase of $75 Million Aggregate Principal Amount of Senior Unsecured Notes
YahooEmergent BioSolutions Awarded Contract Modification Valued at Approximately $24 Million for CYFENDUS® (Anthrax Vaccine Adsorbed, Adjuvanted)
YahooEmergent BioSolutions Receives ~$24M Contract Modification From Biomedical Advanced Research And Development Authority For Strategic Preparedness Response Within U.S. Department Of Health And Human Services To Provide CYFENDUS
BenzingaEmergent BioSolutions Awarded Government of Canada Standing Offer for NARCAN® Nasal Spray
YahooEmergent BioSolutions Reinforces Commitment to Opioid Overdose Education and Preparedness on International Overdose Awareness Day
YahooEmergent BioSolutions Receives Canada's Offer To Provide NARCAN Nasal Spray, Effective Oct. 1 Through September 2029
BenzingaJP Morgan Reinstates Underweight on Emergent BioSolutions
BenzingaHC Wainwright & Co. Maintains Buy on Emergent BioSolutions, Lowers Price Target to $10
BenzingaEmergent BioSolutions Inc. (EBS) Q2 2026 Earnings Call Transcript
SeekingAlpha









Nachrichten von Drittquellen bereitgestellt. Keine Finanzberatung.
Analyse
Aus den DatenAlle Zahlen oben werden bei jedem täglichen Neuaufbau aus den Daten dieser Seite gelesen. Nur zur Information, keine Finanzberatung. Stand: 21. Oktober 2026.
Ähnliche Arzneimittelhersteller - Spezial & Generika-Aktien
Takeda Pharmaceutical Company Limited
63,67 Mrd. $
TEVATeva Pharmaceutical Industries Limited
47,37 Mrd. $
HLNHaleon plc
44,06 Mrd. $
ZTSZoetis Inc.
32,90 Mrd. $
UTHRUnited Therapeutics Corporation
24,17 Mrd. $
VTRSViatris Inc.
21,19 Mrd. $
Beliebte Gesundheitswesen Aktien
Eli Lilly and Company
1,13 Bio. $
JNJJohnson & Johnson
621,22 Mrd. $
ABBVAbbVie Inc.
503,27 Mrd. $
UNHUnitedHealth Group Incorporated
374,30 Mrd. $
MRKMerck & Co., Inc.
369,78 Mrd. $