NYSE · Farmaceutische Fabrikanten - Specialistisch & Generiek · USD
Emergent BioSolutions Inc. (EBS) Aandelenanalyse
Emergent BioSolutions Inc. (EBS) is een Farmaceutische Fabrikanten - Specialistisch & Generiek-aandeel dat noteert op NYSE in Amerikaanse dollar.
Laatst bijgewerkt: 21 oktober 2026
Koersverloop
Geen koersgegevens beschikbaar
Beweeg over de grafiek voor de dagelijkse slotkoers. De stippellijn markeert de opening van de periode.
EBS Kerncijfers
Per 21 okt 2026Handel
- Opening
- $ 6,30
- Vorige slotkoers
- $ 6,29
- Dagbereik
- 6,15–6,38
- 52-weeksbereik
- 4,36–14,06
- Volume
- 851,59K
- BètaHoeveel de koers beweegt ten opzichte van de markt. 1,0 beweegt mee; hoger schommelt meer, lager minder.
- 2,29
Waardering
- Marktkapitalisatie
- $ 317,89 mln.
- K/W-verhouding
- niet winstgevend
- Verwachte K/WKoers gedeeld door de verwachte winst voor het komende jaar in plaats van het afgelopen jaar.
- 5,92
- PEG-ratioDe koers-winstverhouding gedeeld door de verwachte winstgroei. Plaatst een hoge K/W in de context van groei.
- 0,38
- K/O-verhoudingMarktwaarde gedeeld door de jaaromzet. Nuttig bij nog niet winstgevende bedrijven zonder K/W.
- 0,41
- WPA (12 mnd)Winst per aandeel over de afgelopen twaalf maanden.
- −3,40
Cijfers (boekjaar)
- Omzet (boekjaar)
- $ 705,20 mln.−30,43%
- Nettowinst (boekjaar)
- $ 52,60 mln.
- WinstmargeHet deel van de omzet dat na alle kosten en belastingen als winst overblijft.
- −22,96%
- Uitstaande aandelen
- 51,27 mln.
- Rendement 1 jaar
- −34,39%
Dividend en data
- Cijferdatum
- 2 november 2026
- Gem. Volume
- 1,20 mln.
Alleen kengetallen die het bedrijf rapporteert worden getoond. Gegevens verstrekt door Yahoo Finance via yfinance. Dagelijks bijgewerkt.
Kerngegevens
Per 21 oktober 2026 sloot EBS op $ 6,20, −34,39% over 1 jaar.
Emergent BioSolutions Inc. (EBS) heeft een marktkapitalisatie van $ 317,89 mln.
In boekjaar 2025 boekte EBS een omzet van $ 705,20 mln.
EBS Rendement per kalenderjaar
Rendement van Emergent BioSolutions Inc. (EBS) over 10 jaar: wat er van $ 10.000 werd
- 1 jaar
- $ 10.000 $ 6.561
- −34,39%
- 5 jaar
- $ 10.000 $ 1.226
- −87,74%
- 10 jaar
- $ 10.000 $ 2.203
- −77,97%
Als je 10 jaar geleden $ 10.000 in Emergent BioSolutions Inc. (EBS) had belegd tegen de slotkoers van 21 oktober 2016, was die belegging $ 2.203 waard geweest bij de slotkoers van 21 oktober 2026: −77,97% in totaal, −14,04% per jaar. Historische berekening op basis van slotkoersen gecorrigeerd voor splitsingen en dividenden, vóór kosten en belastingen.
Kalenderjaarrendementen berekend op dagelijkse slotkoersen. Deeljaren worden gedempt weergegeven en gemarkeerd met een sterretje.
| Jaar | Rendement |
|---|---|
| 2026 (deeljaar) | −49,84% |
| 2025 | +29,29% |
| 2024 | +298,33% |
| 2023 | −79,68% |
| 2022 | −72,83% |
| 2021 | −51,48% |
| 2020 | +66,08% |
| 2019 | −8,99% |
| 2018 | +27,57% |
| 2017 | +41,50% |
| 2016 (deeljaar) | +10,31% |
Per 21 oktober 2026.
EBS Omzet en winst per boekjaar
Einde boekjaar: december| Boekjaar | Omzet | Nettowinst | Nettomarge |
|---|---|---|---|
| 2025 | $ 705,20 mln. | $ 52,60 mln. | 7,5% |
| 2024 | $ 1,01 mld. | −$ 190,60 mln. | −18,8% |
| 2023 | $ 1,02 mld. | −$ 760,50 mln. | −74,3% |
| 2022 | $ 1,08 mld. | −$ 211,60 mln. | −19,7% |
| Boekjaar | Omzet | Brutowinst | Bedrijfsresultaat | Nettowinst | Nettomarge |
|---|---|---|---|---|---|
| 2025 | $ 705,20 mln. | $ 379,00 mln. | $ 112,30 mln. | $ 52,60 mln. | 7,5% |
| 2024 | $ 1,01 mld. | $ 332,30 mln. | −$ 81,50 mln. | −$ 190,60 mln. | −18,8% |
| 2023 | $ 1,02 mld. | $ 317,60 mln. | −$ 201,50 mln. | −$ 760,50 mln. | −74,3% |
| 2022 | $ 1,08 mld. | $ 383,00 mln. | −$ 163,30 mln. | −$ 211,60 mln. | −19,7% |
Jaarcijfers zoals gerapporteerd, in de rapportagevaluta van het bedrijf. Per 31 december 2025.
Waardering van EBS versus de Farmaceutische Fabrikanten - Specialistisch & Generiek-mediaan
Mediaan van 97 aandelen| Kengetal | EBS | Farmaceutische Fabrikanten - Specialistisch & Generiek-mediaan | T.o.v. mediaan |
|---|---|---|---|
| K/O-verhouding | 0,41 | 2,10 | 0,2x de mediaan |
| Winstmarge | −22,96% | −8,14% | 14,8 ppt lager |
Medianen over 97 Farmaceutische Fabrikanten - Specialistisch & Generiek-aandelen die het kengetal rapporteren. Medianen, geen gemiddelden, zodat één uitschieter ze niet verschuift. Per 21 oktober 2026.
Laatste Nieuws
Emergent BioSolutions stock falls as CFO plans retirement
YahooEmergent BioSolutions Announces Retirement of Chief Financial Officer Richard S. Lindahl
YahooEmergent Biosolutions Appoints Treasurer Frank Vargo As Interim CFO, Effective Jan. 1, 2027, Succeeding Richard Lindahl
BenzingaEmergent BioSolutions to Report Third Quarter 2026 Financial Results on November 2, 2026
YahooEmergent Biosolutions (EBS) Soars 14.4%: Is Further Upside Left in the Stock?
YahooNVAX, EBS, ARCT, MRNA Rally After Russia Plague Lab Worker's Death: Retail Traders Eye 'Contract Awards'
Stocktwits





Alle 20 artikelen ↓Minder tonen ↑
Media Advisory: Emergent to Host Ribbon Cutting Ceremony at Canton Manufacturing Facility
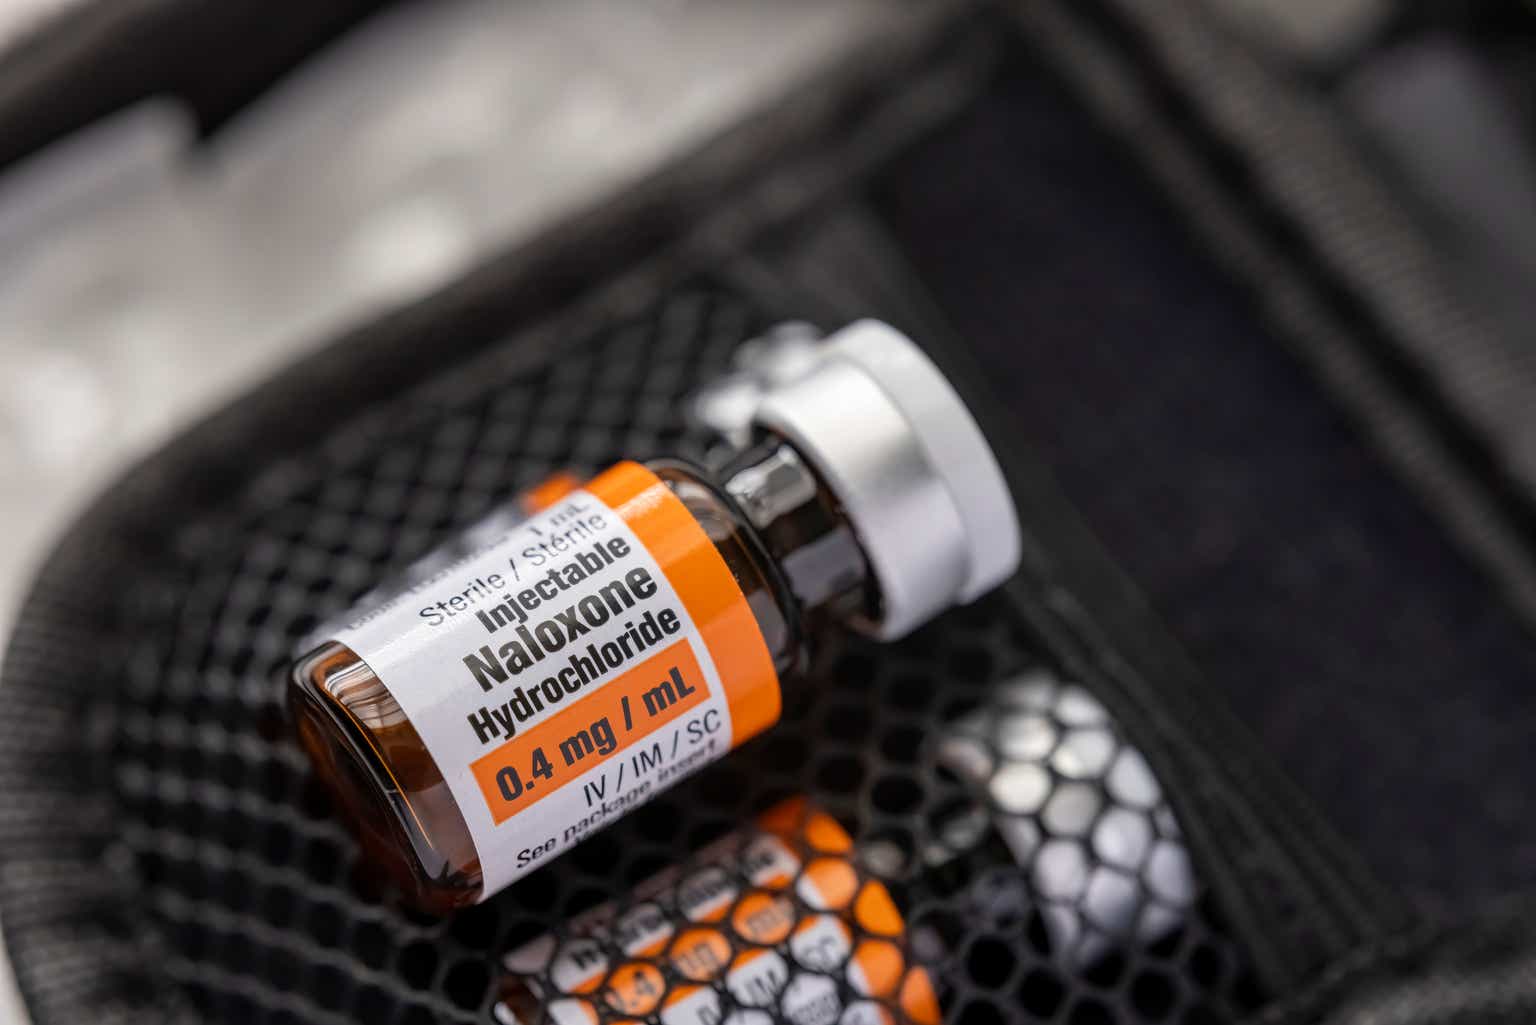
YahooEmergent: The MCM Engine Runs, But Naloxone Is Breaking Down
SeekingAlphaHC Wainwright & Co. Reiterates Buy on Emergent BioSolutions, Maintains $10 Price Target
BenzingaVaccines Global Market Intelligence Report 2026-2035 Featuring Bio Farma, Emergent BioSolutions, GC Pharma, GlaxoSmithKline, Janssen, Merck, Novavax, Moderna, Pfizer, Sanofi Pasteur, and Valneva
YahooEmergent BioSolutions - Tough 2026 Outlook Warrant Rating Downgrade
SeekingAlphaEmergent BioSolutions Completes Repurchase of $75 Million Aggregate Principal Amount of Senior Unsecured Notes
YahooEmergent BioSolutions Awarded Contract Modification Valued at Approximately $24 Million for CYFENDUS® (Anthrax Vaccine Adsorbed, Adjuvanted)
YahooEmergent BioSolutions Receives ~$24M Contract Modification From Biomedical Advanced Research And Development Authority For Strategic Preparedness Response Within U.S. Department Of Health And Human Services To Provide CYFENDUS
BenzingaEmergent BioSolutions Awarded Government of Canada Standing Offer for NARCAN® Nasal Spray
YahooEmergent BioSolutions Reinforces Commitment to Opioid Overdose Education and Preparedness on International Overdose Awareness Day
YahooEmergent BioSolutions Receives Canada's Offer To Provide NARCAN Nasal Spray, Effective Oct. 1 Through September 2029
BenzingaJP Morgan Reinstates Underweight on Emergent BioSolutions
BenzingaHC Wainwright & Co. Maintains Buy on Emergent BioSolutions, Lowers Price Target to $10
BenzingaEmergent BioSolutions Inc. (EBS) Q2 2026 Earnings Call Transcript
SeekingAlpha









Nieuws geleverd door externe bronnen. Geen financieel advies.
Analyse
Uit de dataAlle cijfers hierboven worden bij elke dagelijkse herbouw uit de gegevens van deze pagina gelezen. Alleen ter informatie, geen financieel advies. Per 21 oktober 2026.
Gerelateerde Farmaceutische Fabrikanten - Specialistisch & Generiek Aandelen
Takeda Pharmaceutical Company Limited
$ 63,67 mld.
TEVATeva Pharmaceutical Industries Limited
$ 47,37 mld.
HLNHaleon plc
$ 44,06 mld.
ZTSZoetis Inc.
$ 32,90 mld.
UTHRUnited Therapeutics Corporation
$ 24,17 mld.
VTRSViatris Inc.
$ 21,19 mld.
Populaire Gezondheidszorg aandelen
Eli Lilly and Company
$ 1,13 bln.
JNJJohnson & Johnson
$ 621,22 mld.
ABBVAbbVie Inc.
$ 503,27 mld.
UNHUnitedHealth Group Incorporated
$ 374,30 mld.
MRKMerck & Co., Inc.
$ 369,78 mld.