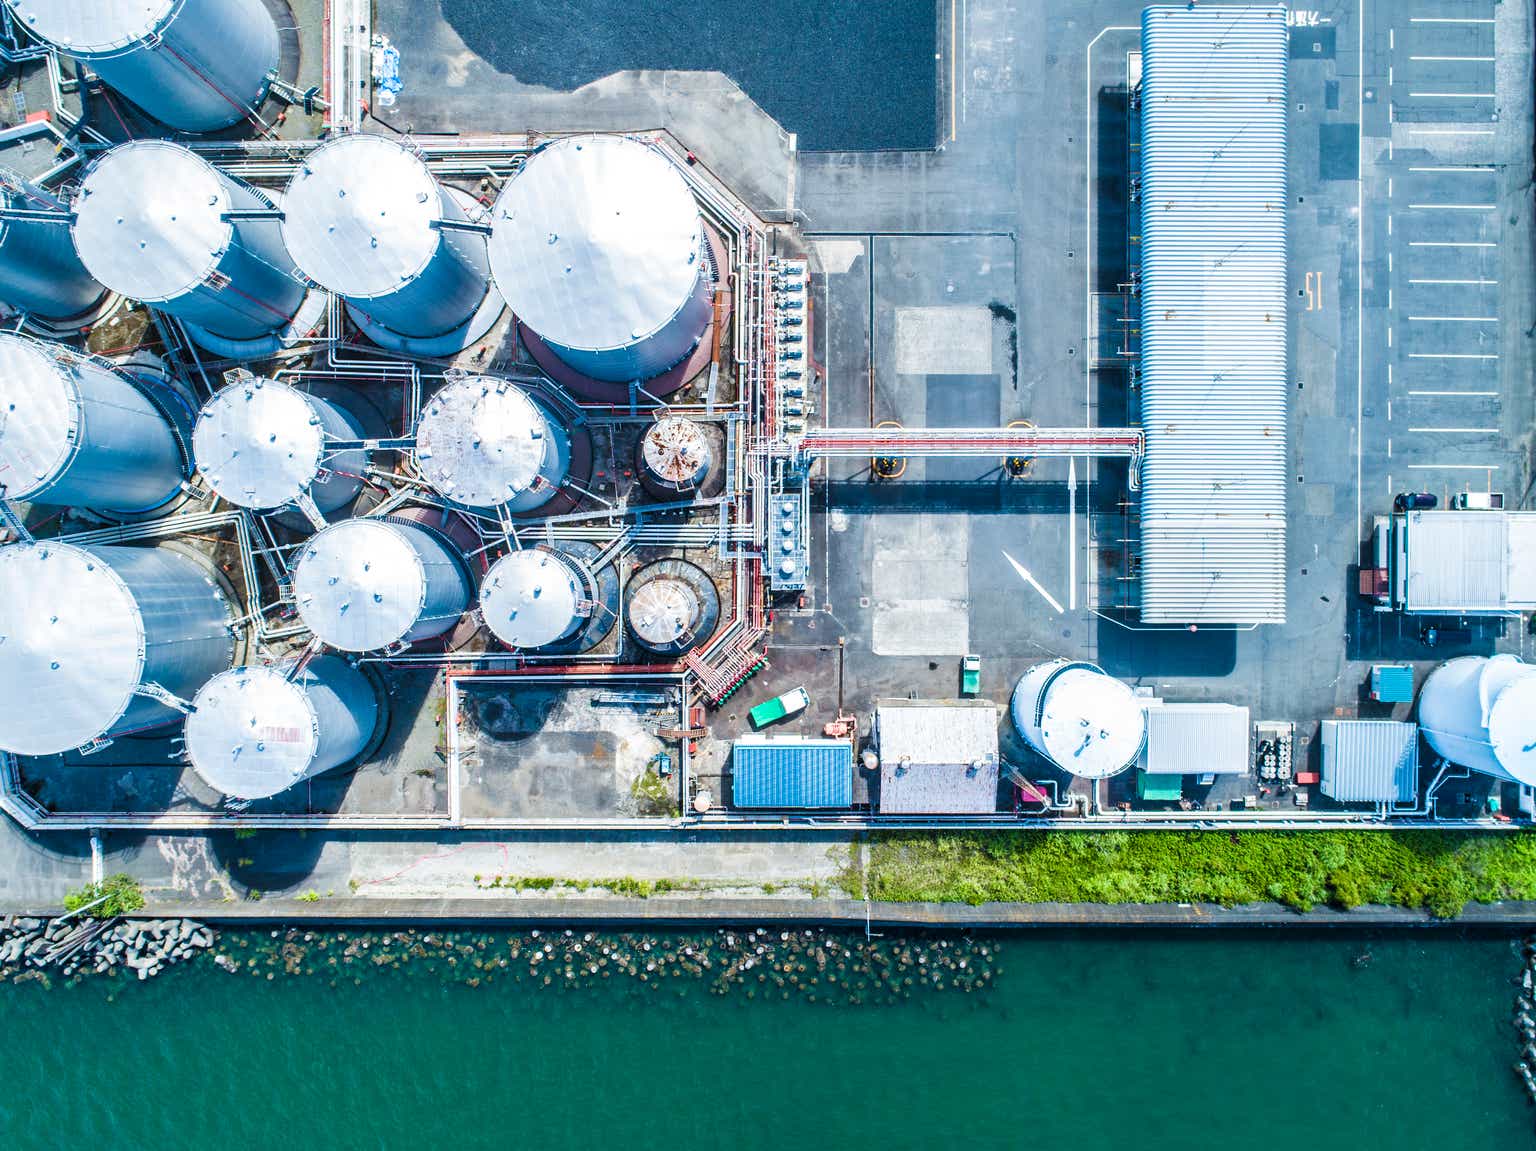
WaterBridge Infrastructure LLC (WBI) 股票分析
能源WaterBridge Infrastructure LLC
$31.15
$-0.01 (-0.03%)
最后更新: 2026年5月26日
价格走势
暂无价格数据
分析
公司概述
WaterBridge Infrastructure LLC operates as a specialized water infrastructure company dedicated to providing comprehensive water management solutions through integrated pipeline and water handling networks located within the United States. Its core business offerings include produced water handling and gathering pipeline services, alongside solutions for brackish water, recycled water, and produced water systems. The company functions within the Energy sector, specifically the Oil & Gas Equipment & Services industry, positioning it as a critical upstream service provider for the hydrocarbon extraction value chain. With a market capitalization of $1.20 billion, annual revenue of $525.55 million, and an employee base of 540, the firm demonstrates a significant operational footprint. These valuation and revenue figures indicate that WaterBridge has established itself as a substantial player in the specialized infrastructure market, commanding a market capitalization that reflects its essential role in managing the complex logistics of water resources associated with energy production.
财务健康
The company reported a trailing twelve-month revenue of $525.55 million against a net income of -$4,537,000, revealing a distinct disparity between top-line growth and bottom-line profitability that points to high cost structures or significant operational expenses eroding earnings. While the net income figure is negative, the EBITDA stands at $233.57 million, suggesting that while accounting for interest and taxes impacts net income, the core operating cash generation before financing costs remains robust. However, the free cash flow stands at -$116,018,248, which indicates that the company is currently burning cash, potentially limiting its financial flexibility for capital expenditures or strategic acquisitions in the short term. Profitability analysis shows a gross margin of 53.9%, an operating margin of 10.7%, and a negative profit margin of -0.9%, illustrating that while the company retains a significant portion of revenue after direct costs, overheads and other expenses are substantial enough to turn overall operations into a loss. On the balance sheet, the company holds $51.54 million in cash but carries a total debt load of $1.44 billion, resulting in a debt-to-equity ratio of 78.18, which characterizes the capital structure as highly leveraged rather than conservative. Liquidity is assessed via a current ratio of 1.38, indicating that the company possesses sufficient current assets to cover its short-term liabilities, though the margin is relatively narrow given the heavy debt burden. Return metrics further highlight the financial pressure, with a return on equity of -1.3% and a return on assets of 2.2%, revealing that management effectiveness has not yet translated into positive shareholder value or asset appreciation relative to the capital invested.
估值评估
The valuation profile is characterized by a trailing P/E ratio that is technically N/A due to negative earnings, while the forward P/E stands at 42.20, implying that the market prices the stock based on anticipated future earnings recovery rather than historical performance. The price-to-book ratio is 1.84, indicating that the market values the company at a significant premium over its book value, likely reflecting intangible assets or growth expectations despite current profitability challenges. Alternative valuation metrics provide additional context, with a price-to-sales ratio of 2.29 and an EV/EBITDA of 16.04, suggesting the market is willing to pay a premium for revenue and operating cash flow generation despite the lack of net income. The stock's trading range over the past year spans from a 52-week low of $18.64 to a 52-week high of $28.97, providing a historical volatility band for price analysis. Although the beta value is not disclosed (N/A), the wide spread between the high and low suggests inherent price volatility typical of infrastructure and energy service stocks. The forward P/E of 42.20, significantly higher than the N/A trailing P/E, underscores the market's reliance on future earnings expectations to justify the current equity price.
Growth & Income
Revenue growth for the trailing twelve months was an impressive 139.5% year-over-year, whereas earnings growth is listed as N/A due to the company's negative net income position. This divergence indicates that the company is experiencing rapid top-line expansion that has not yet permeated to the bottom line, a common phenomenon during aggressive scaling or market share acquisition phases. Regarding income distribution, the company has a dividend yield of 0.2% and a payout ratio of 0.0%, confirming that it is a non-dividend payer that reinvests all available earnings back into the business rather than distributing cash to shareholders. The negligible dividend yield further supports the conclusion that the firm prioritizes capital retention and operational growth over income generation for investors. Consequently, the overall growth and income profile is defined by exceptional revenue acceleration and a complete absence of dividend distributions, reflecting a capital allocation strategy focused on long-term infrastructure deployment and market expansion rather than immediate shareholder returns.
同行比较
WaterBridge Infrastructure LLC (WBI) 在石油和天然气设备与服务行业运营。以下是其与市值最接近的同行的比较:
| 公司 | 代码 | 市值 | 市盈率 |
|---|---|---|---|
| WaterBridge Infrastructure LLC | WBI | $1.46B | 445.0 |
| SLB N.V. | SLB | $86.68B | 25.5 |
| Baker Hughes Company | BKR | $66.20B | 21.3 |
| Halliburton Company | HAL | $34.32B | 22.7 |
石油和天然气设备与服务行业平均市盈率为88.2倍。WaterBridge Infrastructure LLC的市盈率为445.0。
本分析由AI生成,仅供参考,不构成投资建议。数据可能存在延迟或不准确。在做出投资决策之前,请务必进行自己的研究并咨询合格的财务顾问。
相关石油和天然气设备与服务股票
SLB N.V.
$86.68B
BKRBaker Hughes Company
$66.20B
HALHalliburton Company
$34.32B
TSTenaris S.A.
$31.65B
FTITechnipFMC plc
$28.47B
WFRDWeatherford International plc
$7.83B
能源热门股票
Exxon Mobil Corporation
$620.95B
CVXChevron Corporation
$367.87B
SHELShell plc
$236.50B
TTETotalEnergies SE
$200.15B
ENB.TOEnbridge Inc.
$171.99B
关于WaterBridge Infrastructure LLC
WaterBridge Infrastructure LLC, water infrastructure company, provides water management solutions through integrated pipeline and water handling networks in the United States. It offers produced water handling and gathering pipeline services; brackish water, recycled water, and produced water solutions; and gas transportation services. The company was incorporated in 2025 and is headquartered in Houston, Texas.
公司简介以英文显示。
访问官网 →关键指标
- 市值
- $1.46B
- 市盈率
- 445.00
- 52周最高
- $31.90
- 52周最低
- $18.64
- 平均成交量
- 907.99K
- 股息率
- 0.32%
数据由Yahoo Finance通过yfinance提供。每日更新。
公司信息
- 行业
- 石油和天然气设备与服务
- 交易所
- NYSE
- 国家
- United States
- 员工数
- 540