NYSE · Strutture Sanitarie · USD
Fresenius Medical Care AG (FMS) Analisi del titolo
Fresenius Medical Care AG (FMS) è un'azione del settore Strutture Sanitarie quotata su NYSE e negoziata in dollaro statunitense.
Ultimo aggiornamento: 21 ottobre 2026
Storico Prezzi
Nessun dato sui prezzi disponibile
Passa il mouse per vedere la chiusura giornaliera. La linea tratteggiata indica l'apertura del periodo.
Statistiche chiave di FMS
Dati al 21 ott 2026Negoziazione
- Apertura
- 21,53 $
- Chiusura precedente
- 21,41 $
- Intervallo del giorno
- 21,45–21,67
- Intervallo 52 settimane
- 20,02–27,43
- Volume
- 1,14 Mln
- BetaQuanto il titolo si muove rispetto al mercato. 1,0 segue il mercato; sopra oscilla di più, sotto di meno.
- 0,81
Valutazione
- Capitalizzazione
- 11,47 Mld $
- Rapporto P/E
- 11,11
- P/E prospetticoPrezzo dell'azione diviso per l'utile atteso del prossimo anno, non di quello trascorso.
- 7,25
- Rapporto PEGIl rapporto P/E diviso per la crescita attesa degli utili. Contestualizza un P/E alto rispetto alla crescita.
- 0,71
- Rapporto P/SValore di mercato diviso per i ricavi annui. Utile per società non ancora redditizie, dove il P/E non esiste.
- 0,59
- EPS (12 m)Utile attribuibile a ciascuna azione negli ultimi dodici mesi.
- 1,94
Bilancio (esercizio)
- Ricavi (esercizio)
- 19,63 Mld $+1,51%
- Utile netto (esercizio)
- 978,37 Mln $+81,88%
- Margine di profittoQuota dei ricavi che resta come utile dopo costi e imposte.
- 4,83%
- Azioni in circolazione
- 532,22 Mln
- Rendimento 1 anno
- −17,30%
Dividendo e date
- Dividendo
- 0,87 $+4,07%
- Data di stacco
- 22 maggio 2026
- Data dei risultati
- 3 novembre 2026
- Volume Medio
- 890,53K
Sono mostrati solo gli indicatori che la società riporta. Dati forniti da Yahoo Finance tramite yfinance. Aggiornato quotidianamente.
Dati chiave
Al 21 ottobre 2026, FMS ha chiuso a 21,56 $, −17,30% su 1 anno.
Fresenius Medical Care AG (FMS) ha una capitalizzazione di mercato di 11,47 Mld $.
Nell'esercizio 2025, FMS ha registrato ricavi di 19,63 Mld $.
Rendimento di FMS per anno solare
Rendimento di Fresenius Medical Care AG (FMS) a 10 anni: che cosa sono diventati 10.000 $
- 1 anno
- 10.000 $ 8270 $
- −17,30%
- 5 anni
- 10.000 $ 6928 $
- −30,72%
- 10 anni
- 10.000 $ 6504 $
- −34,96%
Se avessi investito 10.000 $ in Fresenius Medical Care AG (FMS) 10 anni fa, alla chiusura del 21 ottobre 2016, l'investimento varrebbe 6504 $ alla chiusura del 21 ottobre 2026: −34,96% in totale, −4,21% all'anno, con i dividendi reinvestiti. Calcolo storico sui prezzi di chiusura rettificati per frazionamenti e dividendi, al lordo di commissioni e imposte.
Rendimenti per anno solare calcolati sui prezzi di chiusura giornalieri. Gli anni parziali sono mostrati attenuati e contrassegnati con un asterisco.
| Anno | Rendimento |
|---|---|
| 2026 (anno parziale) | −5,84% |
| 2025 | +8,22% |
| 2024 | +11,86% |
| 2023 | +30,88% |
| 2022 | −48,42% |
| 2021 | −20,28% |
| 2020 | +14,73% |
| 2019 | +15,62% |
| 2018 | −37,60% |
| 2017 | +25,89% |
| 2016 (anno parziale) | −8,14% |
Dati al 21 ottobre 2026.
Ricavi e utili di FMS per esercizio
Chiusura esercizio: dicembre| Esercizio | Ricavi | Utile netto | Margine netto |
|---|---|---|---|
| 2025 | 19,63 Mld $ | 978,37 Mln $ | 5,0% |
| 2024 | 19,34 Mld $ | 537,91 Mln $ | 2,8% |
| 2023 | 19,45 Mld $ | 499,00 Mln $ | 2,6% |
| 2022 | 19,40 Mld $ | 673,41 Mln $ | 3,5% |
| Esercizio | Ricavi | Utile lordo | Reddito operativo | Utile netto | Margine netto |
|---|---|---|---|---|---|
| 2025 | 19,63 Mld $ | 5,03 Mld $ | 1,83 Mld $ | 978,37 Mln $ | 5,0% |
| 2024 | 19,34 Mld $ | 4,76 Mld $ | 1,47 Mld $ | 537,91 Mln $ | 2,8% |
| 2023 | 19,45 Mld $ | 4,93 Mld $ | 1,48 Mld $ | 499,00 Mln $ | 2,6% |
| 2022 | 19,40 Mld $ | 4,89 Mld $ | 1,45 Mld $ | 673,41 Mln $ | 3,5% |
Dati annuali come riportati, nella valuta di bilancio della società. Dati al 31 dicembre 2025.
Storico dei dividendi di FMS
Dividendo per azione, 2025 · pagamenti: 1
| Anno | Dividendo per azione | Pagamenti | Variazione |
|---|---|---|---|
| 2026* | 0,87 $ | 1 | — |
| 2025 | 0,82 $ | 1 | +28,5% |
| 2024 | 0,63 $ | 1 | +2,6% |
| 2023 | 0,62 $ | 1 | −12,8% |
| Anno | Dividendo per azione | Pagamenti | Variazione |
|---|---|---|---|
| 2026 (anno parziale) | 0,87 $ | 1 | — |
| 2025 | 0,82 $ | 1 | +28,5% |
| 2024 | 0,63 $ | 1 | +2,6% |
| 2023 | 0,62 $ | 1 | −12,8% |
| 2022 | 0,71 $ | 1 | −15,0% |
| 2021 | 0,83 $ | 1 | +18,0% |
| 2020 | 0,71 $ | 1 | +7,9% |
| 2019 | 0,66 $ | 1 | +3,6% |
| 2018 | 0,63 $ | 1 | +23,0% |
| 2017 | 0,51 $ | 1 | — |
Ultimo pagamento: 0,87 $ per azione, stacco cedola il 22 maggio 2026. Importi per azione sommati per anno solare in base alle date di stacco. Gli anni parziali sono mostrati attenuati e contrassegnati con un asterisco.
Valutazione di FMS rispetto alla mediana Strutture Sanitarie
Mediana su 54 azioni| Indicatore | FMS | Mediana Strutture Sanitarie | Rispetto alla mediana |
|---|---|---|---|
| P/E | 11,11 | 20,67 | 46% sotto |
| Rapporto P/S | 0,59 | 0,87 | 32% sotto |
| Margine di profitto | 4,83% | 3,19% | 1,6 p.p. sopra |
Mediane su 54 azioni Strutture Sanitarie che riportano l'indicatore. Mediane, non medie, così un valore anomalo non le sposta. Dati al 21 ottobre 2026.
Ultime Notizie
Fresenius Medical Care presents new evidence and innovations advancing kidney care at ASN Kidney Week 2026
YahooTruist Securities Maintains Hold on Fresenius Medical Care, Lowers Price Target to $24
BenzingaShervin J. Korangy appointed CEO of Fresenius Medical Care to lead the next phase of strategic development and long-term profitable growth
YahooFresenius Medical Care Appoints Shervin J. Korangy As CEO Effective October 12; Shervin J. Korangy To Succeed Helen Giza
BenzingaFresenius Medical Care: Margin Expansion Supports The Story, But Growth Remains Limited
SeekingAlphaFresenius Medical Care Reshapes China Portfolio for Long-Term Growth
Yahoo




Tutti i 20 articoli ↓Mostra meno ↑
Fresenius Medical Care Refines China Strategy With Targeted Product Focus
BenzingaFresenius Medical Care Refines China Commercial Strategy with a Focus on Long-Term Growth and Market Leadership
YahooFresenius Medical Care Adjusts China Commercial Strategy To Support Long-Term Growth And Strengthen Market Position Through More Localized Portfolio, Increased Commercialization Of Local Innovation And Focused Go-To-Market Plans
BenzingaFDA Slams Fresenius Over Leaking Dialysis Bags, Warns of Potentially Life-Threatening Risk
YahooFDA Slams Fresenius Over Leaking Dialysis Bags, Warns of Potentially Life-Threatening Risk
BenzingaCan Fresenius Medical's 5008X Rollout Drive the Next Growth Phase?
YahooReasons to Retain Fresenius Medical Stock in Your Portfolio for Now
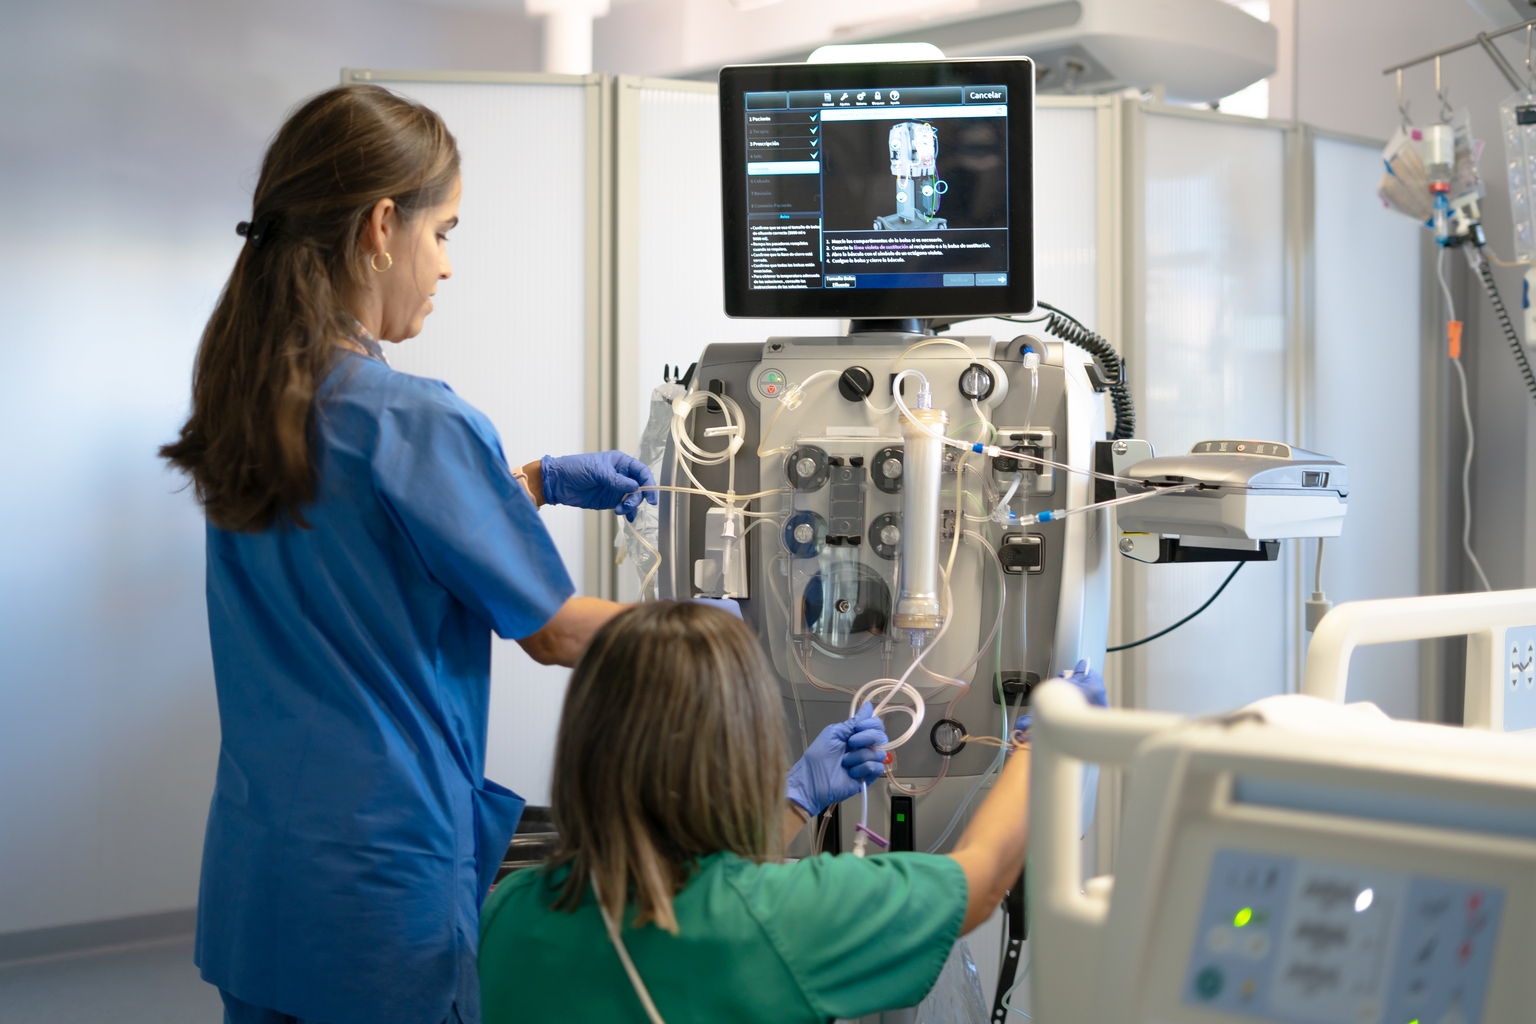
YahooFresenius Medical Care Publishes Global Study On Hemodiafiltration Associated With Lower Relative Risk Of Death From Conventional High-Flux Hemodialysis
BenzingaFresenius Medical Care AG 2026 Q2 - Results - Earnings Call Presentation
SeekingAlphaBernstein Maintains Market Perform on Fresenius Medical Care, Raises Price Target to $25.8
BenzingaFresenius Medical Care AG (FMS) Q2 2026 Earnings Call Transcript
SeekingAlphaFresenius Medical Care Q2 2026 Earnings Call Transcript
BenzingaFresenius Medical Care Affirms FY2026 Sales Guidance of $23.764B vs $22.940B Est
BenzingaFresenius Medical Care Q2 Adj. EPS $0.66 Beats $0.64 Estimate, Sales $5.651B Miss $5.720B Estimate
Benzinga








Notizie fornite da fonti di terze parti. Non costituisce consulenza finanziaria.
Analisi
Derivato dai datiOgni cifra riportata sopra è letta dai dati propri di questa pagina a ogni ricostruzione giornaliera. Solo a scopo informativo, non costituisce consulenza finanziaria. Dati al 21 ottobre 2026.
Azioni Strutture Sanitarie Correlate
HCA Healthcare, Inc.
99,46 Mld $
THCTenet Healthcare Corporation
21,67 Mld $
EHCEncompass Health Corporation
11,88 Mld $
DVADaVita Inc.
11,28 Mld $
UHSUniversal Health Services, Inc.
10,78 Mld $
ENSGThe Ensign Group, Inc.
10,10 Mld $
Azioni popolari Sanità
Eli Lilly and Company
1,13 Bln $
JNJJohnson & Johnson
621,22 Mld $
ABBVAbbVie Inc.
503,27 Mld $
UNHUnitedHealth Group Incorporated
374,30 Mld $
MRKMerck & Co., Inc.
369,78 Mld $