न्यूयॉर्क स्टॉक एक्सचेंज · निर्माण सामग्री · USD
CEMEX, S.A.B. de C.V. (CX) स्टॉक विश्लेषण
CEMEX, S.A.B. de C.V. (CX) निर्माण सामग्री क्षेत्र का स्टॉक है, जो न्यूयॉर्क स्टॉक एक्सचेंज पर सूचीबद्ध है और यूएस डॉलर में कारोबार करता है।
अंतिम अपडेट: 21 अक्टूबर 2026
प्राइस हिस्ट्री
कोई प्राइस डेटा उपलब्ध नहीं है
दैनिक क्लोजिंग प्राइस देखने के लिए कर्सर ले जाएं। बिंदीदार रेखा अवधि का शुरुआती भाव दर्शाती है।
CX मुख्य आंकड़े
21 अक्टू॰ 2026 तक के आंकड़े।ट्रेडिंग
- ओपन
- $10.35
- पिछला बंद भाव
- $10.27
- दिन की रेंज
- 10.27–10.46
- 52-सप्ताह रेंज
- 9.13–13.67
- वॉल्यूम
- 97.37 लाख
- बीटाशेयर की कीमत बाज़ार की तुलना में कितनी चलती है। 1.0 बाज़ार के बराबर, इससे अधिक अधिक उतार-चढ़ाव, कम पर कम।
- 0.81
मूल्यांकन
- मार्केट कैप
- $14.99 अ॰
- P/E अनुपात
- 86.58
- अनुमानित P/Eशेयर मूल्य को बीते वर्ष के बजाय आगामी वर्ष की अनुमानित आय से भाग देकर।
- 11.48
- PEG अनुपातP/E अनुपात को अपेक्षित आय वृद्धि दर से भाग देकर निकाला जाता है। यह ऊंचे P/E को वृद्धि के संदर्भ में रखता है।
- 0.39
- P/S अनुपातबाज़ार मूल्य को वार्षिक राजस्व से भाग देकर। उन कंपनियों के लिए उपयोगी जो लाभ में नहीं हैं और जिनका P/E नहीं निकलता।
- 0.88
- EPS (12 माह)पिछले बारह महीनों में प्रति शेयर आने वाला लाभ।
- 0.12
वित्तीय (वित्त वर्ष)
- राजस्व (वित्त वर्ष)
- $16.13 अ॰+0.43%
- शुद्ध आय (वित्त वर्ष)
- $96.00 क॰+2.24%
- लाभ मार्जिनसभी लागत और करों के बाद राजस्व का वह हिस्सा जो लाभ के रूप में बचता है।
- 2.83%
- बकाया शेयर
- 1.44 अ॰
- 1-वर्ष रिटर्न
- +13.94%
लाभांश और तिथियां
- लाभांश
- $0.12+1.21%
- एक्स-डिविडेंड तिथि
- 15 सितंबर 2026
- परिणाम तिथि
- 26 अक्टूबर 2026
- औसत वॉल्यूम
- 69.86 लाख
केवल वे मापदंड दिखाए जाते हैं जो कंपनी रिपोर्ट करती है। डेटा yfinance के माध्यम से Yahoo Finance द्वारा प्रदान किया गया है। दैनिक अपडेट।
मुख्य तथ्य
21 अक्टूबर 2026 तक, CX $10.39 पर बंद हुआ, 1 वर्ष में +13.94%।
CEMEX, S.A.B. de C.V. (CX) का बाजार पूंजीकरण $14.99 अ॰ है।
वित्त वर्ष 2025 में, CX ने $16.13 अ॰ का राजस्व दर्ज किया।
CX वर्षवार रिटर्न
CEMEX, S.A.B. de C.V. (CX) का 10 साल का रिटर्न: $10,000 का निवेश कितना हुआ
- 1 वर्ष
- $10,000 $11,394
- +13.94%
- 5 वर्ष
- $10,000 $15,387
- +53.87%
- 10 वर्ष
- $10,000 $12,394
- +23.94%
अगर आपने 10 साल पहले, 21 अक्टूबर 2016 के क्लोजिंग प्राइस पर, CEMEX, S.A.B. de C.V. (CX) में $10,000 का निवेश किया होता, तो 21 अक्टूबर 2026 के क्लोजिंग प्राइस पर उसका मूल्य $12,394 होता: कुल +23.94%, सालाना +2.17%, लाभांश के पुनर्निवेश सहित। स्प्लिट और लाभांश के लिए समायोजित क्लोजिंग प्राइस पर आधारित ऐतिहासिक गणना, शुल्क और कर से पहले।
कैलेंडर वर्ष रिटर्न दैनिक क्लोजिंग प्राइस से गणना किए गए हैं। आंशिक वर्ष हल्के रंग में और तारांकन के साथ दिखाए जाते हैं।
| वर्ष | रिटर्न |
|---|---|
| 2026 (आंशिक वर्ष) | −9.16% |
| 2025 | +105.09% |
| 2024 | −26.46% |
| 2023 | +91.36% |
| 2022 | −40.26% |
| 2021 | +31.14% |
| 2020 | +36.77% |
| 2019 | −19.54% |
| 2018 | −35.73% |
| 2017 | −2.86% |
| 2016 (आंशिक वर्ष) | +1.90% |
21 अक्टूबर 2026 तक के आंकड़े।
CX वित्तीय वर्ष अनुसार राजस्व और आय
वित्त वर्ष दिसंबर में समाप्त| वित्तीय वर्ष | राजस्व | शुद्ध आय | शुद्ध मार्जिन |
|---|---|---|---|
| 2025 | $16.13 अ॰ | $96.00 क॰ | 6.0% |
| 2024 | $16.06 अ॰ | $93.90 क॰ | 5.8% |
| 2023 | $16.40 अ॰ | $18.20 क॰ | 1.1% |
| 2022 | $14.71 अ॰ | $85.80 क॰ | 5.8% |
| वित्तीय वर्ष | राजस्व | सकल लाभ | परिचालन आय | शुद्ध आय | शुद्ध मार्जिन |
|---|---|---|---|---|---|
| 2025 | $16.13 अ॰ | $5.31 अ॰ | $1.79 अ॰ | $96.00 क॰ | 6.0% |
| 2024 | $16.06 अ॰ | $5.41 अ॰ | $1.82 अ॰ | $93.90 क॰ | 5.8% |
| 2023 | $16.40 अ॰ | $5.54 अ॰ | $1.95 अ॰ | $18.20 क॰ | 1.1% |
| 2022 | $14.71 अ॰ | $4.49 अ॰ | $1.36 अ॰ | $85.80 क॰ | 5.8% |
कंपनी की रिपोर्टिंग मुद्रा में, रिपोर्ट किए गए वार्षिक आंकड़े। 31 दिसंबर 2025 तक के आंकड़े।
CX लाभांश इतिहास
प्रति शेयर लाभांश, 2025 · 2 भुगतान
| वर्ष | प्रति शेयर लाभांश | भुगतान | बदलाव |
|---|---|---|---|
| 2026* | $0.09 | 3 | — |
| 2025 | $0.04 | 2 | −31.7% |
| 2024 | $0.06 | 3 | — |
| 2019 | $0.10 | 2 | — |
नवीनतम भुगतान: $0.03 प्रति शेयर, एक्स-डिविडेंड 15 सितंबर 2026। एक्स-डिविडेंड तिथियों के आधार पर कैलेंडर वर्ष अनुसार जोड़ी गई प्रति शेयर राशि। आंशिक वर्ष हल्के रंग में और तारांकन के साथ दिखाए जाते हैं।
CX मूल्यांकन बनाम निर्माण सामग्री माध्यिका
19 स्टॉक की माध्यिका| मापदंड | CX | निर्माण सामग्री माध्यिका | माध्यिका से |
|---|---|---|---|
| P/E | 86.58 | 17.83 | माध्यिका का 4.9x |
| P/S अनुपात | 0.88 | 1.47 | 40% कम |
| लाभ मार्जिन | 2.83% | 9.94% | 7.1 अंक कम |
19 निर्माण सामग्री स्टॉक की माध्यिका जो यह मापदंड बताते हैं। औसत नहीं, माध्यिका — इसलिए एक असामान्य मान इसे प्रभावित नहीं करता। 21 अक्टूबर 2026 तक के आंकड़े।
हाल की खबरें
Cemex Supplies Concrete for Major Los Angeles Metro Expansion
YahooCitigroup Upgrades Cemex to Buy, Lowers Price Target to $12
BenzingaRBC Capital Maintains Sector Perform on Cemex, Lowers Price Target to $13.25
BenzingaFortune Again Recognizes Cemex as a Company That Is Changing the World
YahooSaverOne Expands Collaboration with Cemex Germany to Heavy Trucks
YahooCemex: A Strong Rally Leaves Shares Overvalued, Facing Margin Pressure Risks
SeekingAlpha





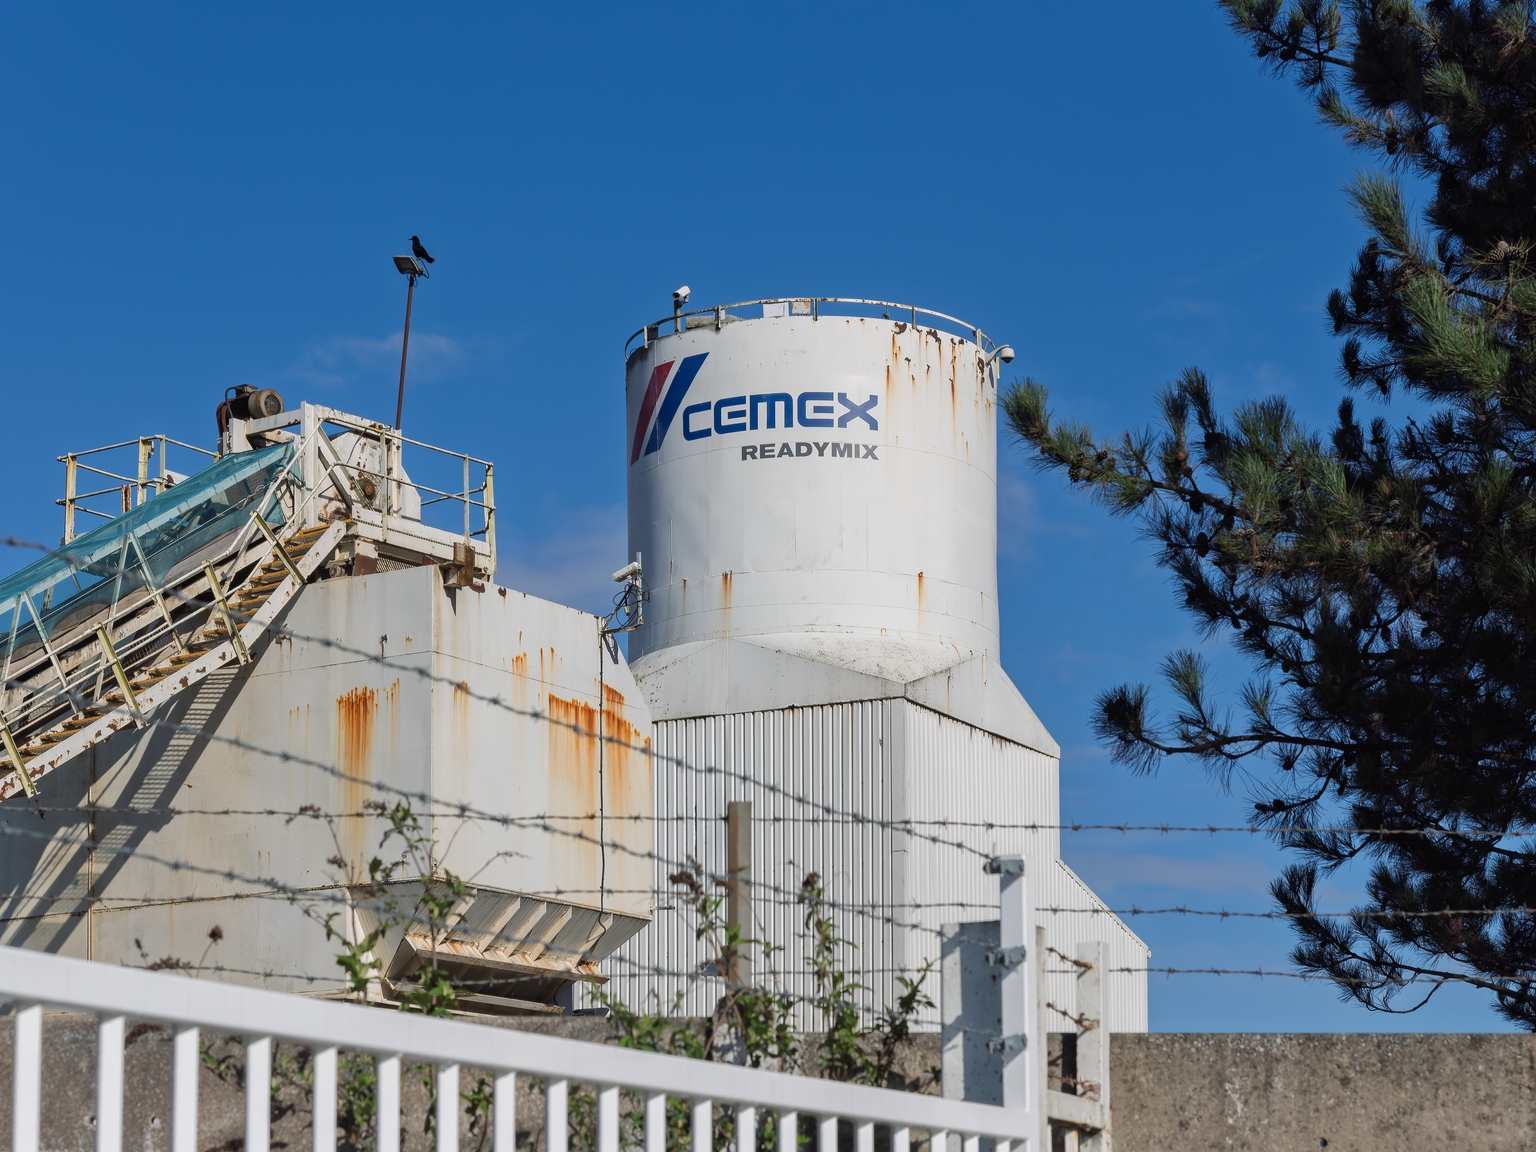
तृतीय-पक्ष स्रोतों द्वारा प्रदान की गई समाचार। वित्तीय सलाह नहीं है।
विश्लेषण
डेटा-आधारितऊपर दिया गया हर आंकड़ा हर दैनिक पुनर्निर्माण में इसी पृष्ठ के अपने डेटा से पढ़ा जाता है। यह केवल जानकारी के लिए है, वित्तीय सलाह नहीं। 21 अक्टूबर 2026 तक के आंकड़े।
संबंधित निर्माण सामग्री स्टॉक्स
CRH plc
$57.23 अ॰
MLMMartin Marietta Materials, Inc.
$36.15 अ॰
VMCVulcan Materials Company
$34.29 अ॰
AMRZAmrize Ltd
$21.22 अ॰
JHXJames Hardie Industries plc
$15.27 अ॰
EXPEagle Materials Inc.
$5.32 अ॰
लोकप्रिय मूल सामग्री स्टॉक
Linde plc
$2.31 ख॰
BHPBHP Group Limited
$2.12 ख॰
SCCOSouthern Copper Corporation
$1.67 ख॰
RIORio Tinto Group
$1.41 ख॰
NEMNewmont Corporation
$1.23 ख॰