NASDAQ · Fabricants de Médicaments - Spécialité et Génériques · USD
Tilray Brands, Inc. (TLRY) Analyse boursière
Tilray Brands, Inc. (TLRY) est une action du secteur Fabricants de Médicaments - Spécialité et Génériques cotée sur NASDAQ et libellée en dollar des États-Unis.
Dernière mise à jour : 21 octobre 2026
Historique des Prix
Aucune donnée de prix disponible
Survolez pour afficher la clôture quotidienne. La ligne pointillée marque l'ouverture de la période.
Statistiques clés de TLRY
Au 21 oct. 2026Cotation
- Ouverture
- 3,06 $
- Clôture précédente
- 3,03 $
- Variation du jour
- 2,91–3,07
- Variation 52 semaines
- 2,91–15,70
- Volume
- 4,19 M
- BêtaAmplitude des mouvements du titre par rapport au marché. 1,0 suit le marché ; au-dessus il varie plus, en dessous moins.
- 1,92
Valorisation
- Capitalisation
- 431,54 M $
- Ratio P/E
- non rentable
- PER prévisionnelCours de l'action divisé par le bénéfice prévu pour l'année à venir, et non l'année écoulée.
- 20,55
- Ratio P/SValeur de marché divisée par le chiffre d'affaires annuel. Utile pour les sociétés non rentables, sans PER calculable.
- 0,45
- BPA (12 m)Bénéfice attribuable à chaque action sur les douze derniers mois.
- −1,41
Finances (exercice)
- Chiffre d'affaires (ex.)
- 915,45 M $+11,46 %
- Résultat net (ex.)
- −121,40 M $
- Marge nettePart du chiffre d'affaires restant en bénéfice après tous les coûts et impôts.
- −17,05 %
- Actions en circulation
- 147,79 M
- Rendement 1 an
- −80,27 %
Dividende et dates
- Date des résultats
- 7 janvier 2027estimée
- Volume Moyen
- 4,21 M
Seules les métriques publiées par la société sont affichées. Données fournies par Yahoo Finance via yfinance. Mis à jour quotidiennement.
Chiffres clés
Au 21 octobre 2026, TLRY a clôturé à 2,92 $, −80,27 % sur 1 an.
Tilray Brands, Inc. (TLRY) affiche une capitalisation boursière de 431,54 M $.
Sur l'exercice 2025, TLRY a réalisé un chiffre d'affaires de 915,45 M $.
Rendement de TLRY par année civile
Rendement depuis juil. 2018 : ce que sont devenus 10 000 $ investis dans Tilray Brands, Inc. (TLRY)
- 1 an
- 10 000 $ 1 973 $
- −80,27 %
- 5 ans
- 10 000 $ 253 $
- −97,47 %
- Depuis juil. 2018
- 10 000 $ 130 $
- −98,70 %
Si vous aviez investi 10 000 $ dans Tilray Brands, Inc. (TLRY) à la clôture du 19 juillet 2018, la plus ancienne clôture enregistrée ici, ce placement vaudrait 130 $ à la clôture du 21 octobre 2026 : −98,70 % au total, −40,88 % par an, sur une période partielle de moins de 10 ans. Calcul historique à partir des cours de clôture ajustés des fractionnements et des dividendes, avant frais et impôts.
Rendements par année civile calculés sur les cours de clôture quotidiens. Les années partielles sont affichées en grisé et signalées par un astérisque.
| Année | Rendement |
|---|---|
| 2026 (année partielle) | −67,66 % |
| 2025 | −32,11 % |
| 2024 | −42,17 % |
| 2023 | −14,50 % |
| 2022 | −61,74 % |
| 2021 | −14,89 % |
| 2020 | −51,78 % |
| 2019 | −75,72 % |
| 2018 (année partielle) | +215,05 % |
Au 21 octobre 2026.
Chiffre d'affaires et résultat de TLRY par exercice
Exercice clos en mai| Exercice | Chiffre d'affaires | Résultat net | Marge nette |
|---|---|---|---|
| 2025 | 915,45 M $ | −121,40 M $ | −13,3 % |
| 2024 | 821,31 M $ | −2,19 Md $ | −266,3 % |
| 2023 | 788,94 M $ | −244,98 M $ | −31,1 % |
| 2022 | 627,12 M $ | −1,45 Md $ | −231,6 % |
| Exercice | Chiffre d'affaires | Marge brute | Résultat opérationnel | Résultat net | Marge nette |
|---|---|---|---|---|---|
| 2025 | 915,45 M $ | 260,44 M $ | −55,26 M $ | −121,40 M $ | −13,3 % |
| 2024 | 821,31 M $ | 240,57 M $ | −107,81 M $ | −2,19 Md $ | −266,3 % |
| 2023 | 788,94 M $ | 223,35 M $ | −112,76 M $ | −244,98 M $ | −31,1 % |
| 2022 | 627,12 M $ | 146,96 M $ | −178,20 M $ | −1,45 Md $ | −231,6 % |
Chiffres annuels tels que publiés, dans la devise de présentation de la société. Au 31 mai 2026.
Valorisation de TLRY face à la médiane Fabricants de Médicaments - Spécialité et Génériques
Médiane de 97 actions| Indicateur | TLRY | Médiane Fabricants de Médicaments - Spécialité et Génériques | Écart médiane |
|---|---|---|---|
| Ratio P/S | 0,45 | 2,10 | 0,2x la médiane |
| Marge nette | −17,05 % | −8,14 % | 8,9 pts en dessous |
Médianes sur 97 actions Fabricants de Médicaments - Spécialité et Génériques publiant l'indicateur. Des médianes, pas des moyennes, pour qu'une valeur aberrante ne les déplace pas. Au 21 octobre 2026.
Actualités Récentes
Canopy Growth vs. Tilray Brands: Which Cannabis Stock Is a Better Buy in 2026?
The Motley FoolTilray Medical Strengthens Global Medical Cannabis Supply Chain with Approval to Bring Critical EU-GMP Quality Testing In-House, Accelerating Product Release Across Regulated Global Markets
YahooTilray Brands’ Unit Tilray Medical Secures Key Regulatory Approval For In-House Testing At Portugal Facility
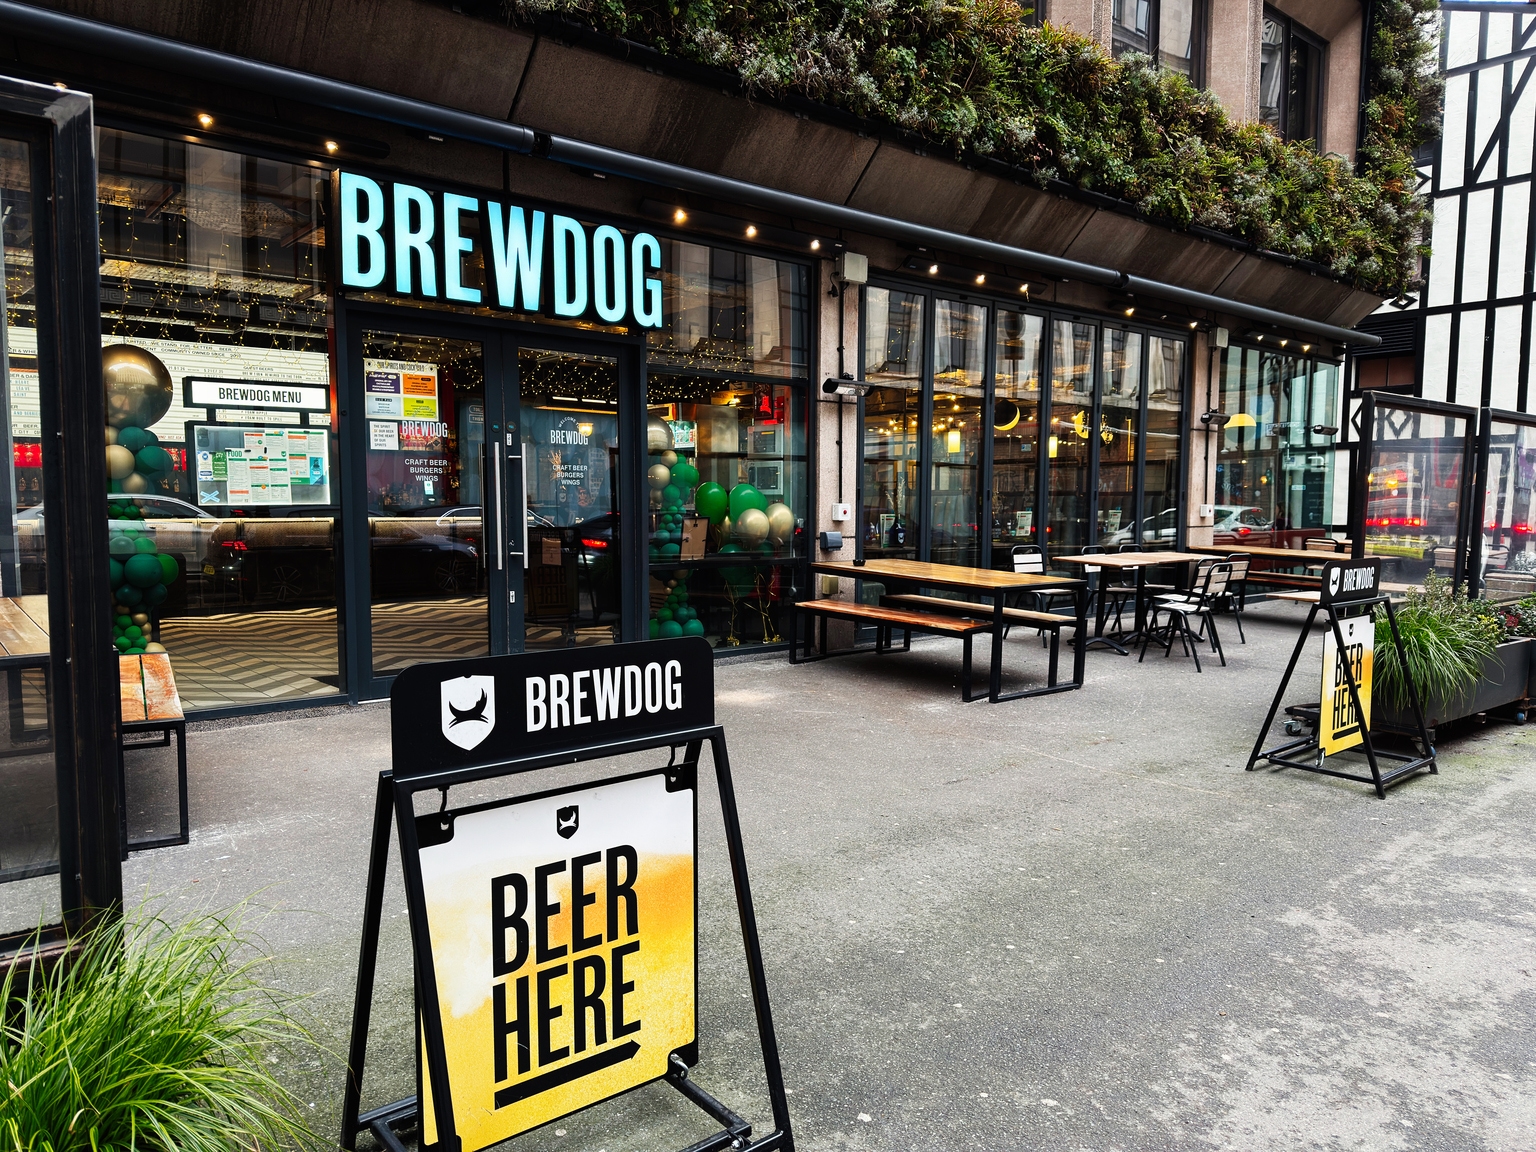
BenzingaBrewDog Acquisition Boosts Tilray's Q1 Performance
SeekingAlpha3 Huge Red Flags From Tilray's Q1 Earnings Report
The Motley FoolTilray Q1: Not Looking Good, Remains A 'Hold'
SeekingAlpha





Tous les 20 articles ↓Afficher moins ↑
Canopy Growth vs. Tilray Brands: Which Healthcare Stock Is a Better Buy in 2026?
The Motley Fool3 Reasons I'm Still Not Buying Tilray Stock -- Even at Penny-Stock Prices
The Motley FoolTilray Finds a Path to Growth Without Waiting on U.S. Cannabis Reform
MarketBeatCanaccord Genuity Maintains Hold on Tilray Brands, Lowers Price Target to $4
BenzingaTilray (TLRY) Q1 2027 Earnings Call Transcript
The Motley FoolTilray Brands, Inc. Q1 2027 Earnings Call Summary
MobyTilray Brands Q1 Earnings Call Highlights
MarketBeatFollowing Tilray Earnings, Here's What Comes Next for TLRY Stock
BarchartTilray Brands Sinks 4% as Record Revenue Masks Shrinking Cannabis Sales; Canopy Growth and Aurora Cannabis Ease
24/7 Wall St.Tilray Brands, Inc. (TLRY) Q1 2027 Earnings Call Transcript
SeekingAlphaTilray revenue rises as beverage business drives record quarterly sales
Proactive InvestorsTilray Brands Q1 Revenue Rises 23% to $257.1 Million as Beverage Sales Surge Following BrewDog Acquisition
InvestorsHubTilray Brands, Inc. (TLRY) Reports Q1 Loss, Misses Revenue Estimates
YahooTilray Brands Delivers Record Q1 Fiscal 2027 Revenue and Record Q1 Gross Profit, Demonstrating the Power of Its Global Platform, Driven by Double-Digit Year-Over-Year Growth Across International Cannabis, Beverage and Pharmaceutical Distribution
Yahoo








Actualités fournies par des sources tierces. Ne constitue pas un conseil financier.
Analyse
Issu des donnéesChaque chiffre ci-dessus est lu à partir des données propres à cette page lors de chaque reconstruction quotidienne. À titre informatif uniquement, ne constitue pas un conseil financier. Au 21 octobre 2026.
Actions Fabricants de Médicaments - Spécialité et Génériques Similaires
Takeda Pharmaceutical Company Limited
63,67 Md $
TEVATeva Pharmaceutical Industries Limited
47,37 Md $
HLNHaleon plc
44,06 Md $
ZTSZoetis Inc.
32,90 Md $
UTHRUnited Therapeutics Corporation
24,17 Md $
VTRSViatris Inc.
21,19 Md $
Actions populaires Santé
Eli Lilly and Company
1,13 Bn $
JNJJohnson & Johnson
621,22 Md $
ABBVAbbVie Inc.
503,27 Md $
UNHUnitedHealth Group Incorporated
374,30 Md $
MRKMerck & Co., Inc.
369,78 Md $